PROCEDURE
The procedure ranged from data acquisition, processing & analysis and web application development as presented in the thesis workflow diagram.
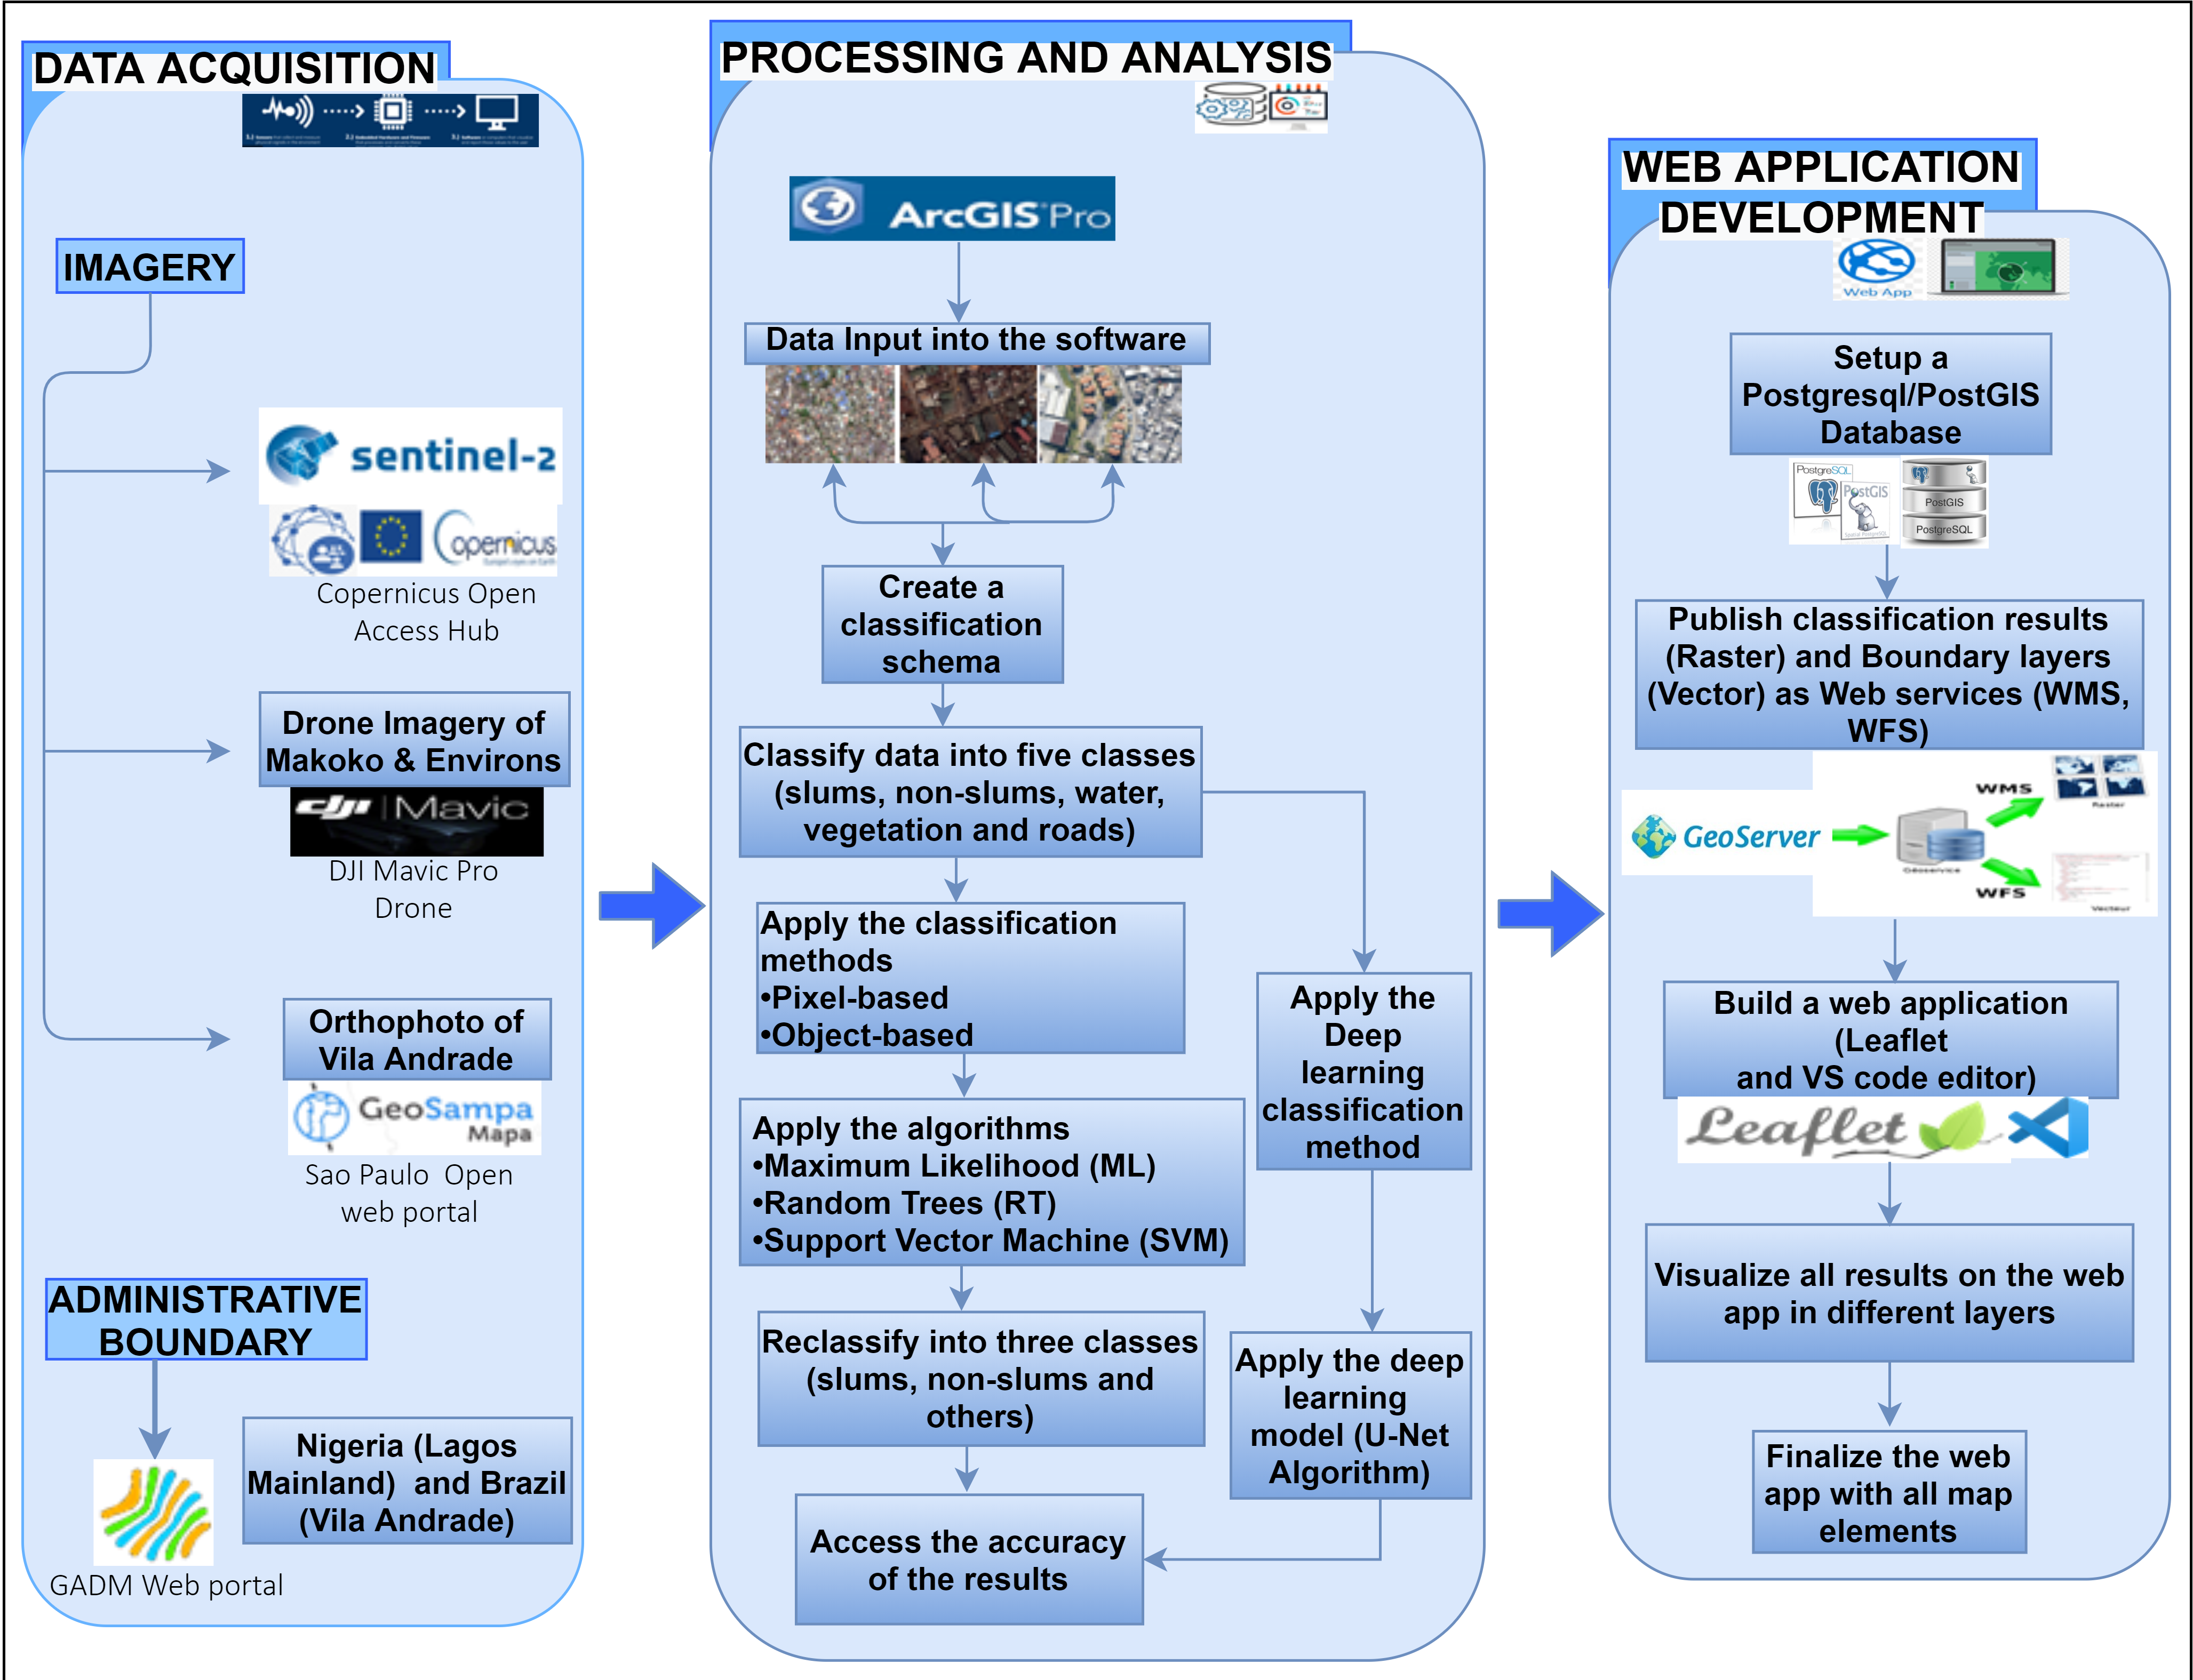
Thesis Workflow Diagram
+DATA ACQUISITION
Sentinel-2 imagery of the study areas were acquired from the Copernicus Open Access Hub web portal (https://scihub.copernicus.eu/). To ensure acquiring data with less cloud cover, imagery with acquisition date (Sensing date) of 26th December 2020 was chosen for Lagos Mainland while Vila Andrade has its imagery with sensing date of 07th November 2020. Both imagery were of the Sentinel-2B platform.
The drone imagery was captured using DJI Mavic Pro drone although it could only cover Makoko and the surrounding part of the urban area (i.e. Makoko and environs) due to persistent restrictions and security concern. The images were acquired on the 24th of January 2021 and has a spatial resolution of 4.9cm. The drone was flown at an altitude of 150m, covered 236 hectares and successfully captured 1,493 images.
The orthophoto of Vila Andrade was downloaded from the Geo Sampa web portal (a repository for Sao Paulo city’s geospatial dataset i.e. orthophoto, old maps, etc.(http://geosampa.prefeitura.sp.gov.br/PaginasPublicas/_SBC.aspx#)). The data was retrieved in tiles and has a spatial resolution of 12cm.
The administrative boundaries of the study areas were downloaded from GADM web portal (https://gadm.org/index.html). The data were downloaded in shapefile format.
PROCESSING AND ANALYSIS
The processing and analysis involved image mosaicing, image classification image classification (pixel-based, object-based and deep learning based).
The drone images were mosaiced with Agisoft Metashape software. The downloaded tiled orthophoto of Vila Andrade were merged with the aid of the mosaic tool in the ArcGIS Pro software.
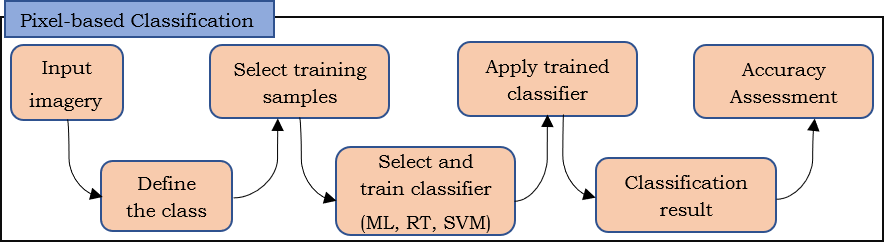
The image classification was carried out in ArcGIS Pro software. ArcGIS Pro has an in-built step for image classification called “Classification Wizard”. For this study, the supervised classification (pixel and object based method) was used because it involves providing training samples to achieve the classified result. The three algorithms (maximum likelihood, random trees and support vector machine) are available for the methods and were employed to classify the imageries.
The image classification kickstarted with creation of project workspace in ArcGIS Pro. The imagery was added to the project workspace and classification schema with five classes were created for the classification, namely slum area (buildings), non-slum area (buildings), water, vegetation and roads. Image segmentation was carried for the object-based method. Training samples for the five classes were selected with the aid of the training samples manager in the classification tools. The samples were applied to both pixel and object-based classification methods. The algorithms (maximum likelihood, random trees and support vector machine) were trained with the training samples and were applied to classify the imagery in a respective manner.
The samples were applied to both pixel and object-based classification methods. The algorithms (maximum likelihood, random trees and support vector machine) were trained with the training samples and were applied to classify the imagery in a respective manner. Some classes were merged to distinctively distinguish slum areas from other classes and accomplish simplified results in the classification. Water, vegetation and roads were merged into a super class named “Others”. After the merging process, a classified result was achieved that displayed three classes (slums {buildings}, non-slums {buildings} and others). This process was followed to classify the Sentinel-2 imagery, followed by the drone imagery and then orthophoto.
The deep learning classification has a separate workflow in ArcGIS Pro and was carried out on the drone imagery and orthophoto using the U-Net algorithm.
Pixel-based Method
+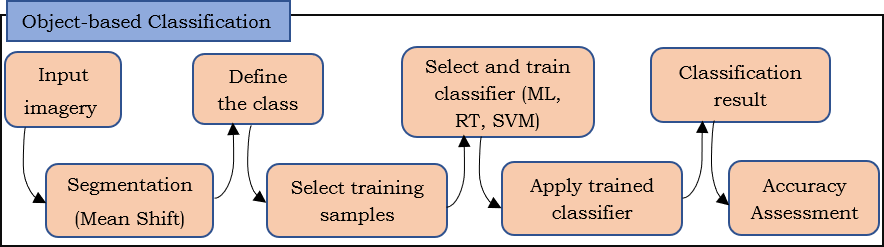
Object-based Method
+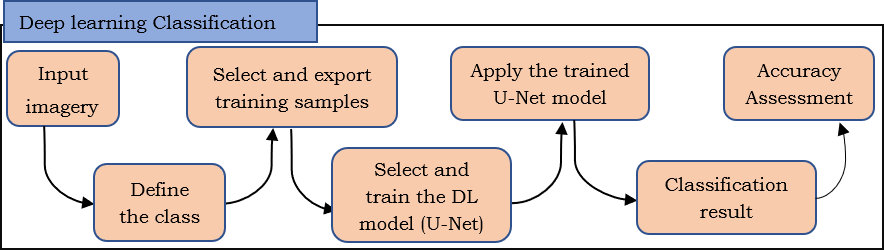
Deep learning Method
+WEB APPLICATION DEVELOPMENT
Development of the web application involved setting up PostgreSQL/PostGIS database, publishing web services on Geoserver and web app creation on Leaflet.
PostgreSQL/PostGIS database was set up to store the vector data (administrative boundary). The study areas' classification results and the administrative boundaries were published as web services using the Geoserver and finally, the web application was developed with the leaflet library and visual code editor.


