Results
Lava flows mapping
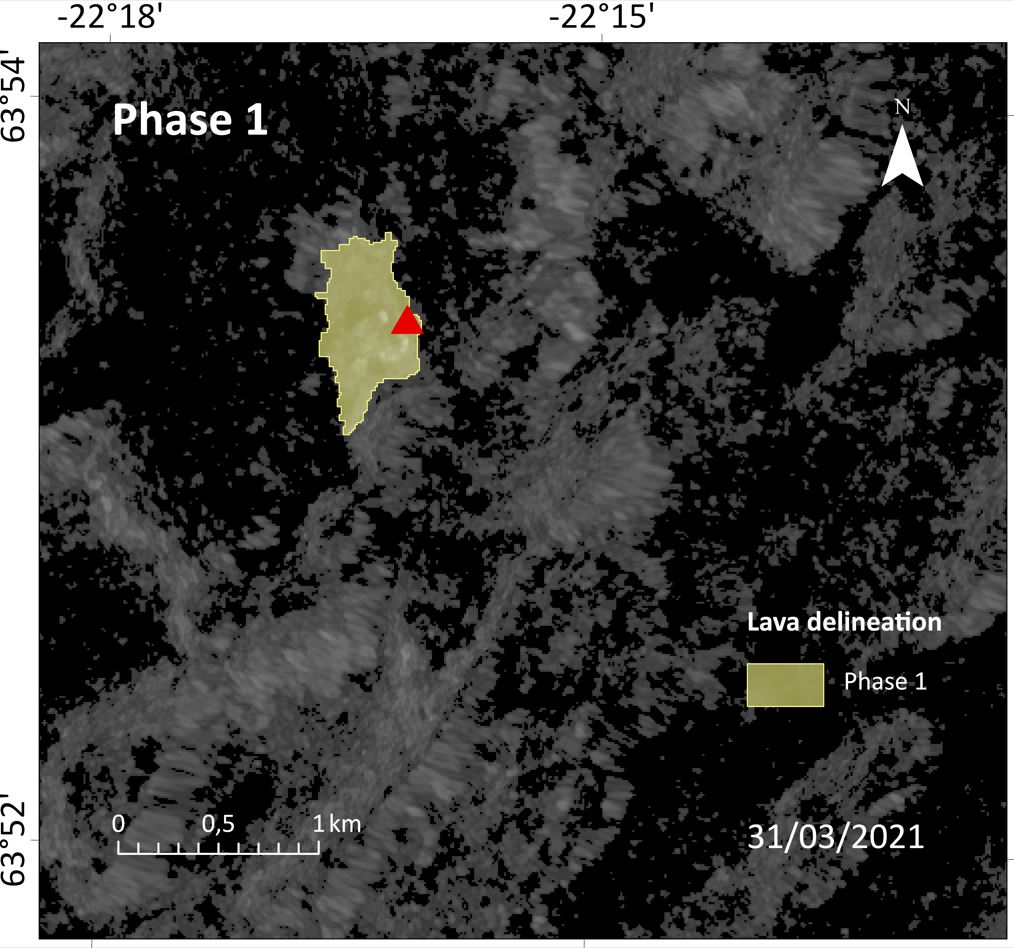
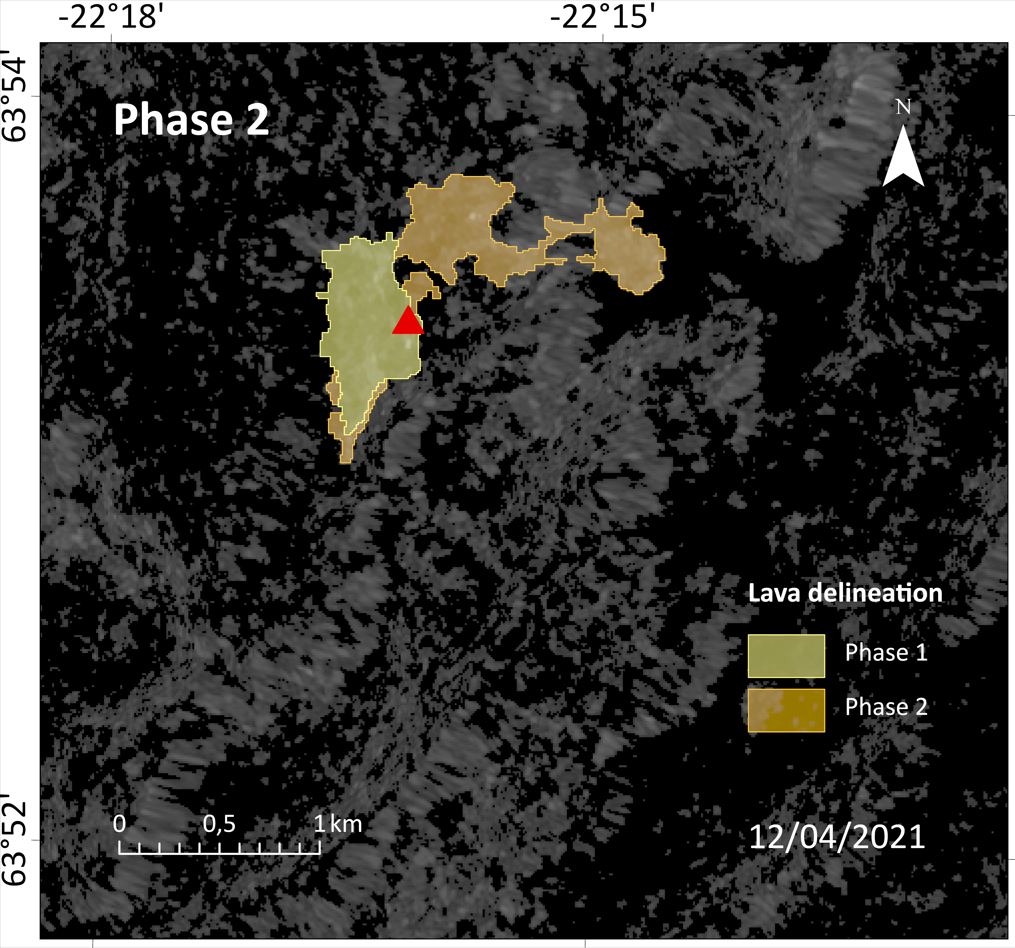
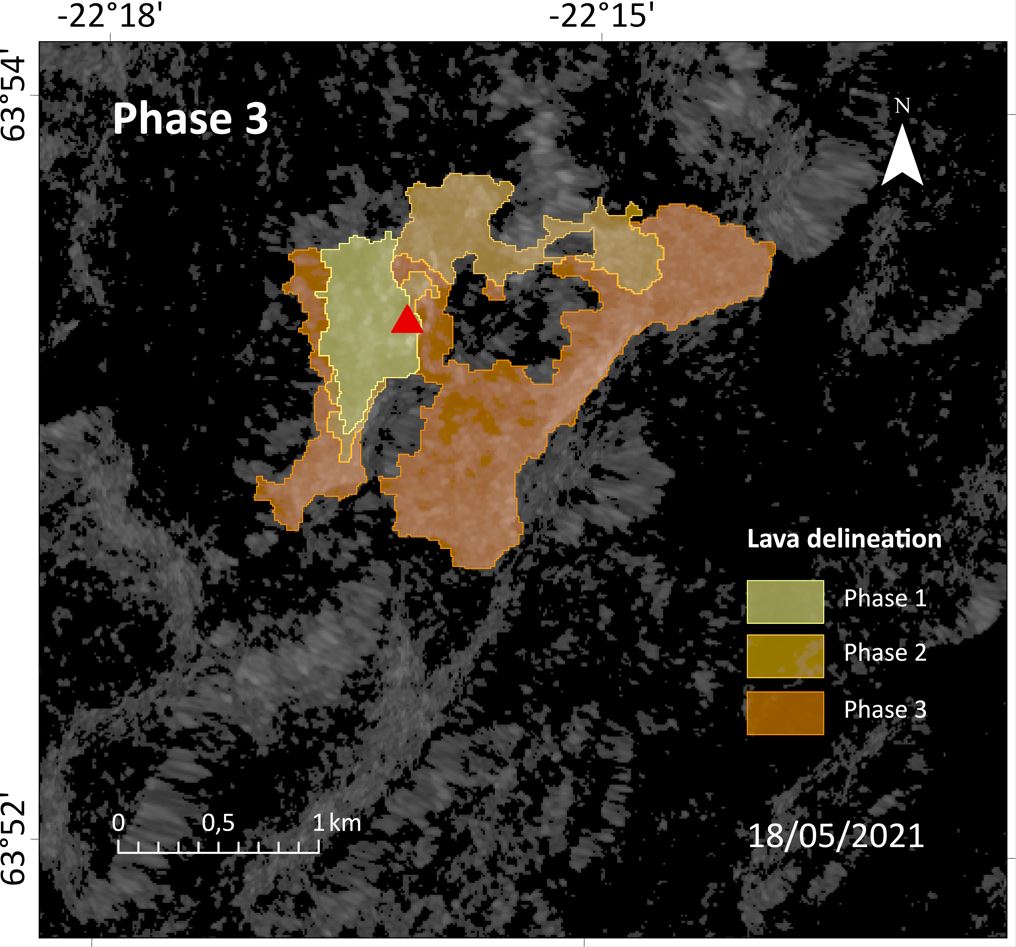
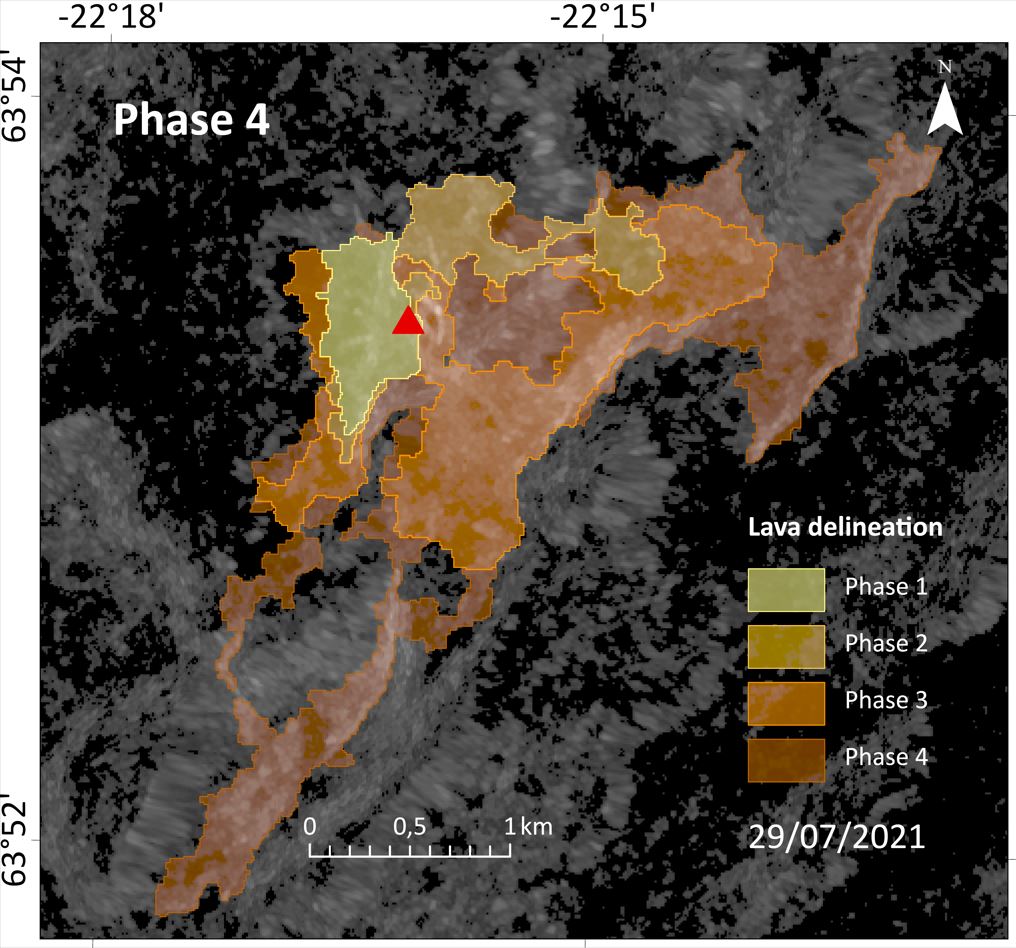
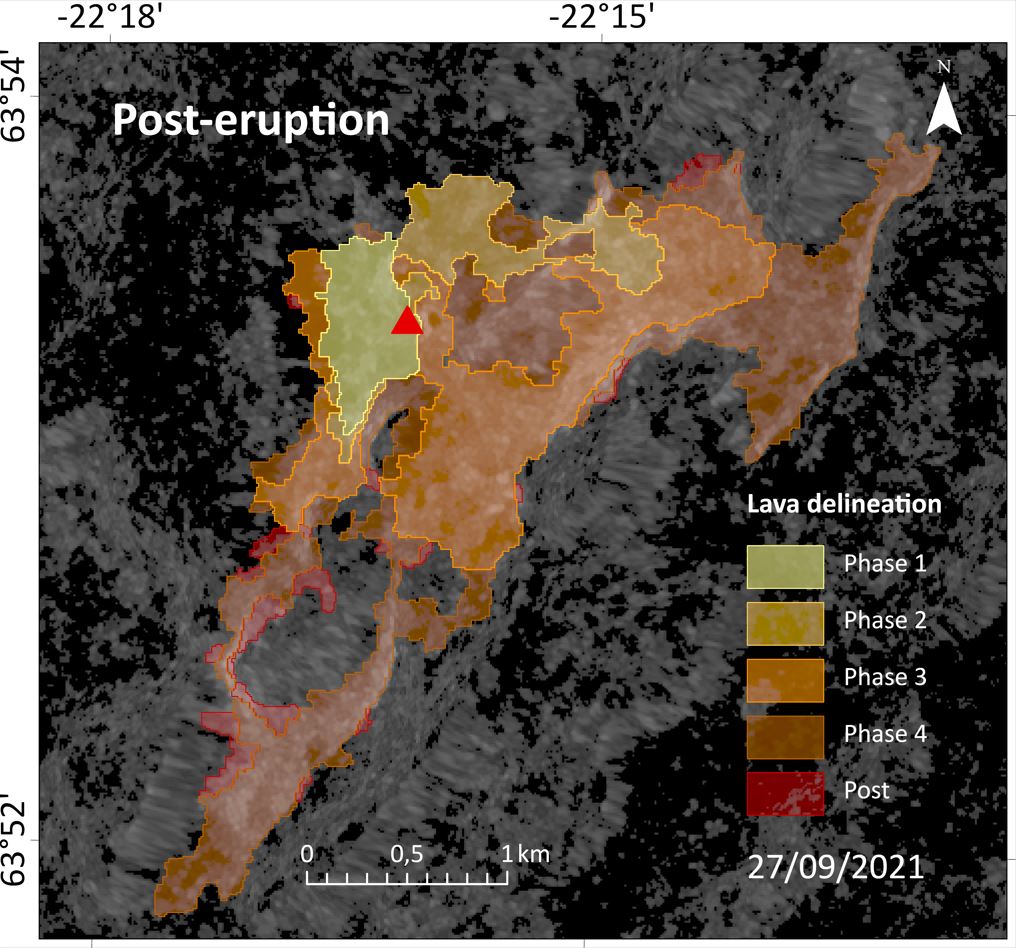
The lava flows of the 2021 Fagradalsfjall eruption were mapped using OBIA and the analysis was performed using eCognition (©Trimble) software. OBIA consists of two major steps: segmentation and classification. Initially, a multiresolution segmentation algorithm was applied to create homogeneous objects by grouping pixels with similar characteristics. For the subsequent classification, some spatial, geometric, and textural properties of the geographic objects were used as inputs in a knowledge-based classification ruleset. Different segmentation parameters and bands were used for the segmentation of each eruptive phase and further refinement of the classification was performed through merging algorithms and considering spatial relations between objects, before validating the results. Visual assessment of the intermediate results and human-driven trial and error tests were used to determine the threshold values for the classification.
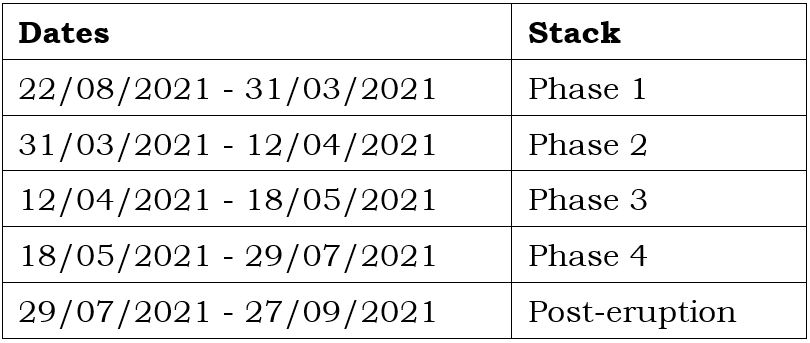
Pairs of consecutive images were selected to create co-registered stacks for each eruptive phase as described in the table above. For each stack, the total amount of bands was 16, eight representing the first image date and eight representing the second image date. All of the bands were conserved to test which of them could be useful for the segmentation and classification of the images when applying the OBIA methodology. The time-series maps are shown below.
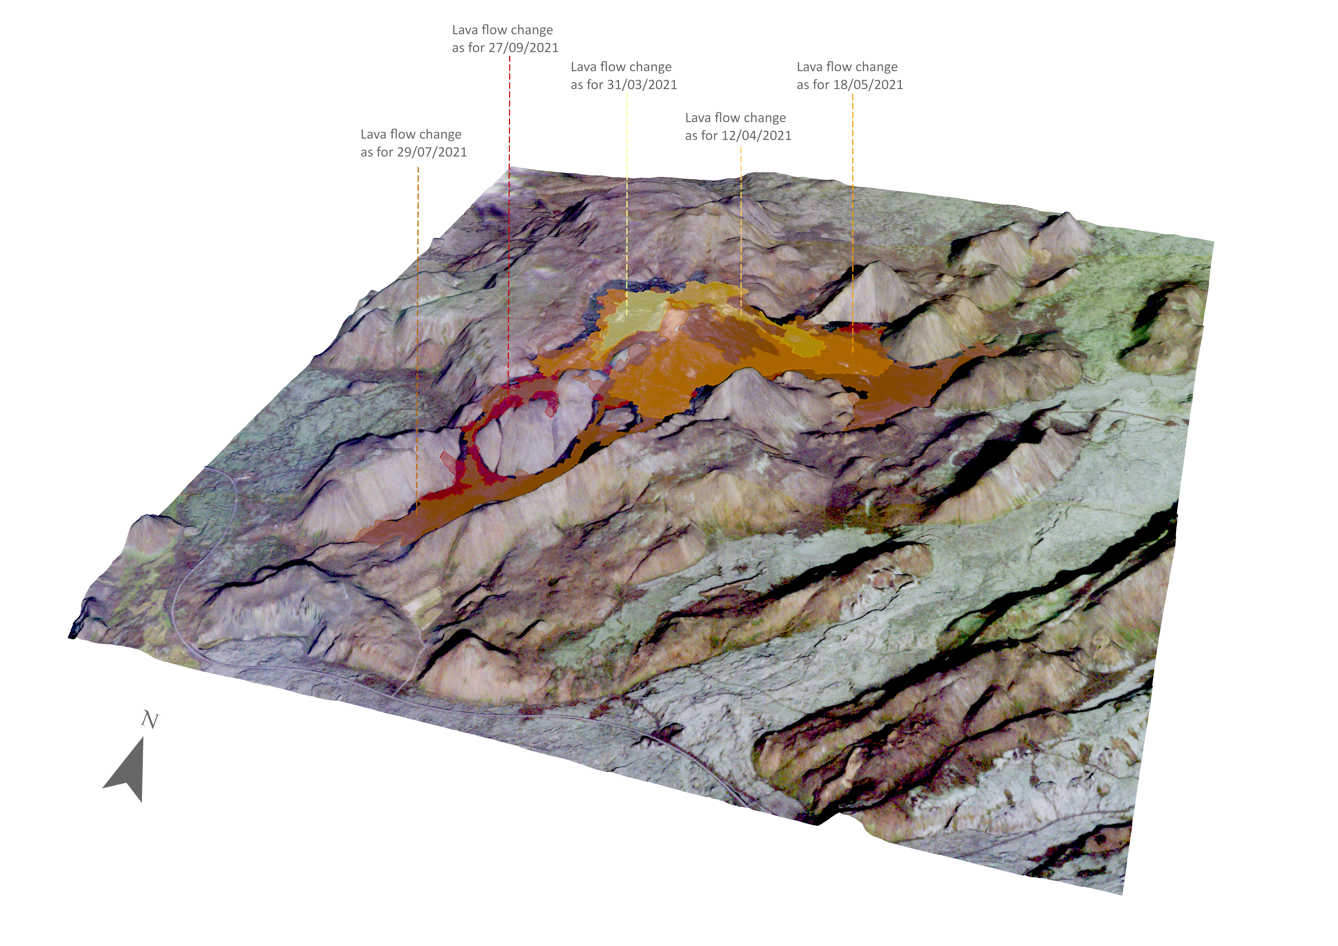
Lava Flow Evolution
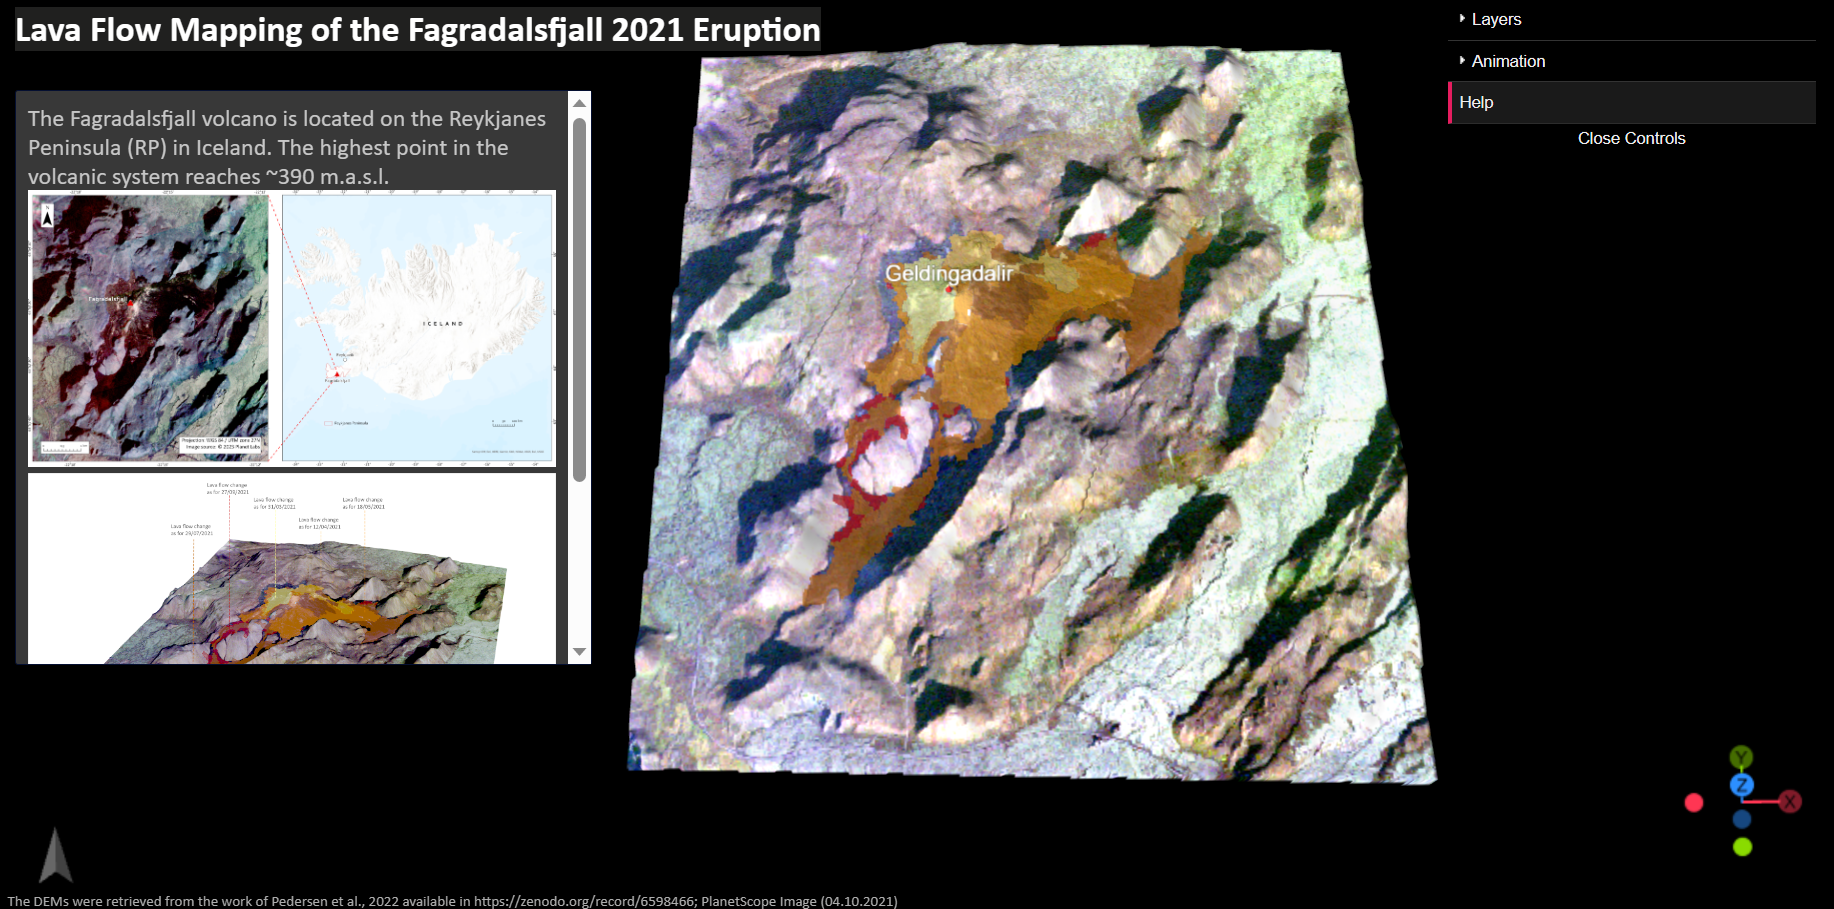
Lava flows visualisation
The visualisation results consist of a 3D web map application and a 3D static map. The web application is hosted in a GitHub repository that can be accessed under the following link: https://github.com/s1085496/FagradalsfjallApp and it was created using the qgis2threejs plugin in QGIS. The application is interactive and tells the story of the 2021 Fagradalsfjall volcanic eruption. Additionally, an animation of the 3D scene can be played on the website.