Annual solar radiation in Morumbi
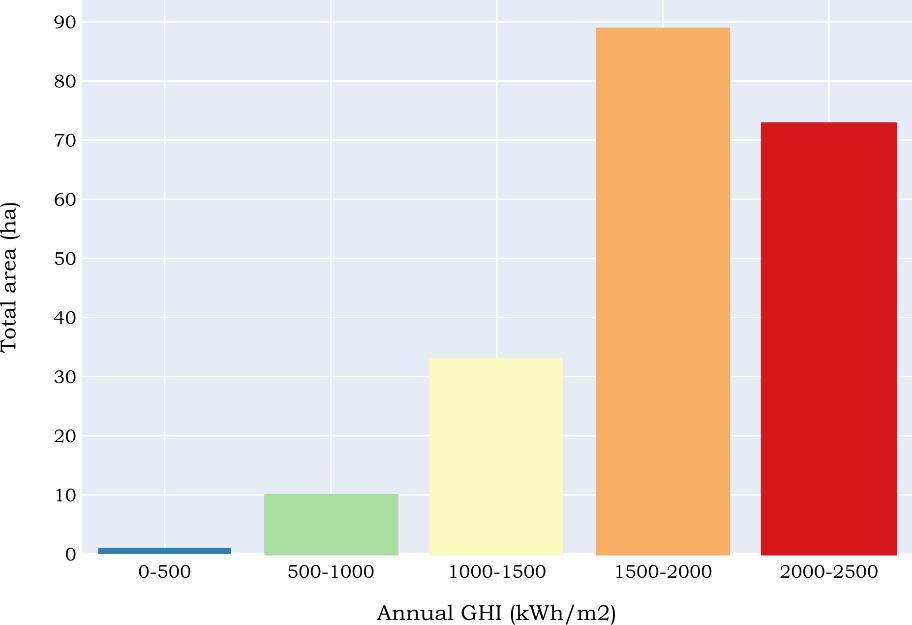
Using raster layer statistics tools in QGIS, it can be identified that the maximum annual solar radiation in the Morumbi area is 2,343.18 kWh/m2, the minimum is 265.74 kWh/m2, and the mean is 1,778.54 kWh/m2. In order to provide better information on the GHI distribution in Morumbi, the area distribution of the GHI interval had been calculated. The GHI was reclassified into five classes, with each class represents the GHI interval. The step was carried out by executing the Reclassification tool in ArcGIS Pro, which provided a vector file as the output. The vector file contains the information of the number of pixel of each class inside the attribute table (COUNT). The total area of each class then derived by multiplying the number of pixels with 0.25 (the area dimension of one pixel) and 0.0001 to convert the unit to hectares.
By dividing the mean solar radiation by 365, the daily solar radiation or GHI can be estimated. The computed average daily GHI in Morumbi is 4.87 kWh/m2. The result can be compared with the average daily GHI from other regions in the southern hemisphere. The country's daily GHI data and estimated PV output were derived from Energy Sector Management Assistance Program (ESMAP) (ESMAP, 2020). The daily GHI of Morumbi is lower than most of the regions with the equivalent latitude, including the average daily GHI in Brazil and slightly higher than the daily GHI in Morumbi. Nevertheless, the daily GHI in Morumbi is higher than the lowest daily solar radiation within Brazil. It can be concluded that there is a great potential for the development of solar PV in Morumbi.
The initial result of the model is 365 raster files correspond to each day of the year (Julian date). Thus, the trend of solar radiation can be identified.

December is the month with the highest solar radiation value. In December, the estimated solar radiation under clear-sky and real-sky conditions are 6,865.49 Wh/m2 and 5,698.35 Wh/m2. June is the month with the lowest solar radiation. The estimated solar radiation under the clear-sky condition and the real-sky condition in June is 3,069.07 Wh/m2. The value of both sky conditions are the same as the clear-sky index value is 1.0. The monthly trend of solar radiation seems to correspond with the seasonal change, as the lowest monthly solar radiation is in the winter season, December, a month in the winter season, receives the highest solar radiation.
Rooftop PV potential
The number of suitable buildings for rooftop PV installation is 10,894, of the total of 11,780 buildings (slums are not taken into account). It indicates that around 92% of buildings in Morumbi are feasible for rooftop solar PV installation.A simple statistical analysis was conducted in QGIS to identify the maximum, minimum, and mean energy yield. The minimum energy yield of a single building in Morumbi is 0.96 MWh, 3839.18 MWh is the maximum, while the mean is 40.22 MWh. The total energy yield from solar PV in the whole study area is 43,8184.59 MWh.
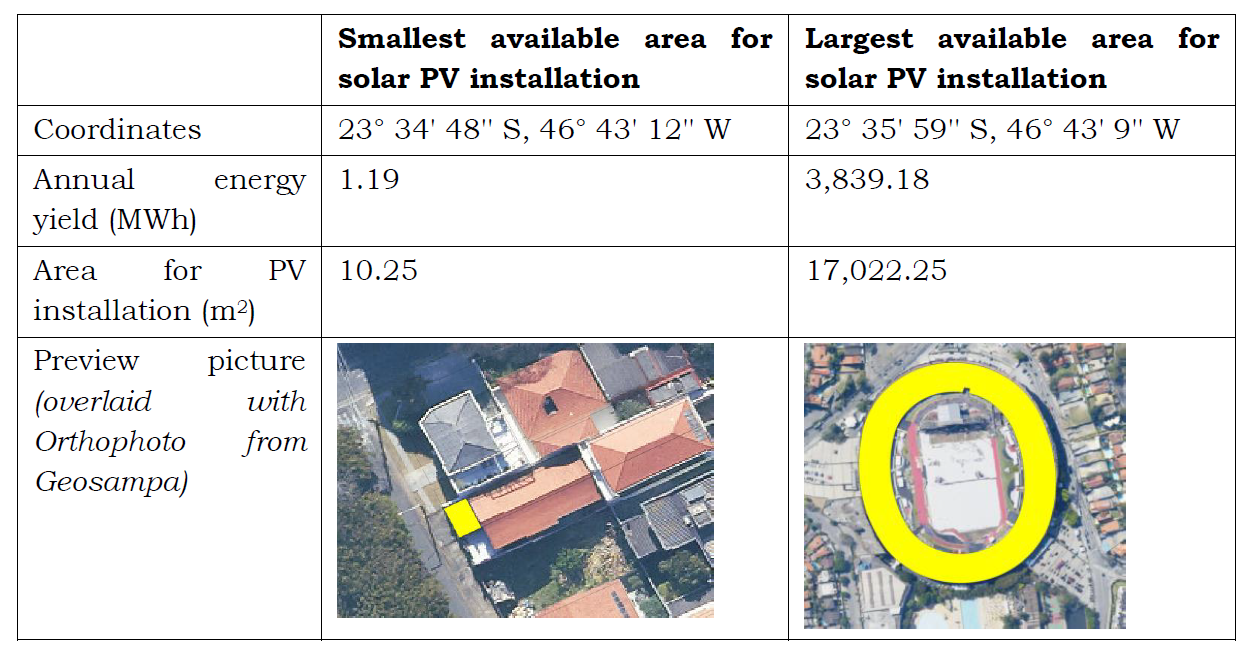
The value distribution range between the mean value and the maximum value is quite significant. This phenomenon is caused by the uneven value distribution of solar energy yield. The produced solar energy is highly dependent on the roof surface dimension. Due to the fact that most of the buildings in Morumbi are residential buildings, the solar energy that can be generated from an individual building falls within the range of 0 to 249 MWh per year. Buildings that produce solar energy from 0 to 249 MWh per year reach 10,810, which is 99% of the total suitable building in the study area. The number of buildings that generate higher solar energy is relatively low, only 1% of the total suitable buildings. The property types that fall under this category are non-residential building, such as office building, shopping arcade, stadium, etc. Buildings with the largest and smallest available area for the solar PV installation d is the following:
Other results derived from the solar PV potential modelling are the PV capacity and CO2 emission savings. The total PV capacity in the Morumbi area is 20,5238.24 kWp or 205.23 MWp. The total CO2 emission that can be saved is 122,691,912 kgCO2e or 122,691.91 metric tons. Referring to the data from Muntean et al. (2018), that the CO2 emission per capita in Brazil is 2.3 t CO2/year, in the case of the whole feasible rooftop surface in the study area will be utilized for solar PV installation, the PV installation will offset the CO2 emission within the whole year from approximately 53,343 individuals.
Impact of the panel inclination adjustment
In the autumn season (March), the highest amount of solar radiation was obtained by modifying the panel inclination to 23° and rotate the panel to be headed north. In June (winter), to receive the most solar radiation on the panel surface, the inclination should be tilted to 25° and rotate to the north. During September (spring), the best setting for solar panel inclination is 23° and heading north. Without modifying the panel inclination but rotating the panel to the north in December (summer), the PV panel will perform better. It should be noted that this analysis would not be incorporated with the real-sky solar radiation layer displayed in the visualization.