Study area
The study area is located in the city of São Paulo, Brazil. São Paulo lies in the southeast region of Brazil, about 350 km southwest of Rio de Janeiro and 50 km inland from the Atlantic Ocean (Schneider et al., 2020). Initially, the author intended to use the entire city of Sao Paulo for the study area. However, during the computation process, a large study area consumed too much of the PC memory and the computation time took a considerably long time. Hence, the research area is being reduced to a district scale. The Morumbi district is then selected as the focus of the research.

Morumbi district in the subprefecture Butanta, city of São Paulo, Brazil, is situated in the southwestern part of the city of São Paulo. The approximate coordinate of Morumbi district is 23°36'00"S and 46°43'6.00"W. It covers an area of 11.47 km². According to the 2010 census, the total population has reached 46,957. The northern side of the district shares border with Butanta and Pinheiros district, Itaim Bibi district to the east, Santo Amaro district to the south, and Vila Sônia to the west. Morumbi is known as a residential district and famous as the area where wealthy people in São Paulo live. The total number of buildings in the area is 15,121, containing residential, commercial, industry, and government offices. One of the city landmarks is also located in the area, Morumbi stadium or Estádio do Morumbi. Residential buildings type in Morumbi varies, from highrise condominium, landed house and favela (slum).
Data sources
The data used in this thesis were entirely derived from multiple non-commercial sources and open data portals. It is intended to support the principle of data openness and transparency. The open data source is non-binding and fully free, also accessible via the internet.
Topographic & Administration data (downloaded from
Geosampa web portal)
- LiDAR point cloud (0.5m res.)
- Building footprint
- District boundary
Atmospheric/climate data
- Linke turbidity -> SoDA database
- Surface albedo
Publication by Ferreira et al. (2011) verif. by
Copernicus Global Land service (Proba-V mission)
Solar radiation, PV specs
- Diurnal irradiation ->
IAG weather station - Solar radiation data from SONDA,
LABREN laboratory & ERA5
(Copernicus CAMS)
(Proba-V mission) - PV spec & installation guide
-> NREL USA - Brazil solar energy market
-> Americadosol project report
Software & tools
Click here for the summary of software and tools.
Workflow
The work in this thesis was conducted within five main stages. The first stage was the data collection and processing, which included downloading LiDAR point cloud data, atmospheric parameters, building footprint and Morumbi district boundary. Afterwards, the workflow continued with modelling solar radiation, using data inputs and parameters that had been processed. The third stage was analyses to obtain additional attributes that will be included in the final visualization. The next stage was the visualization part that covered database management, server setup and web-GIS deployment. Lastly, storing building models and solar energy potential attributes into CityGML format. The entire workflow of the entire step carried out in this thesis is depicted in the following: Click here for displaying figure of the overall workflow.
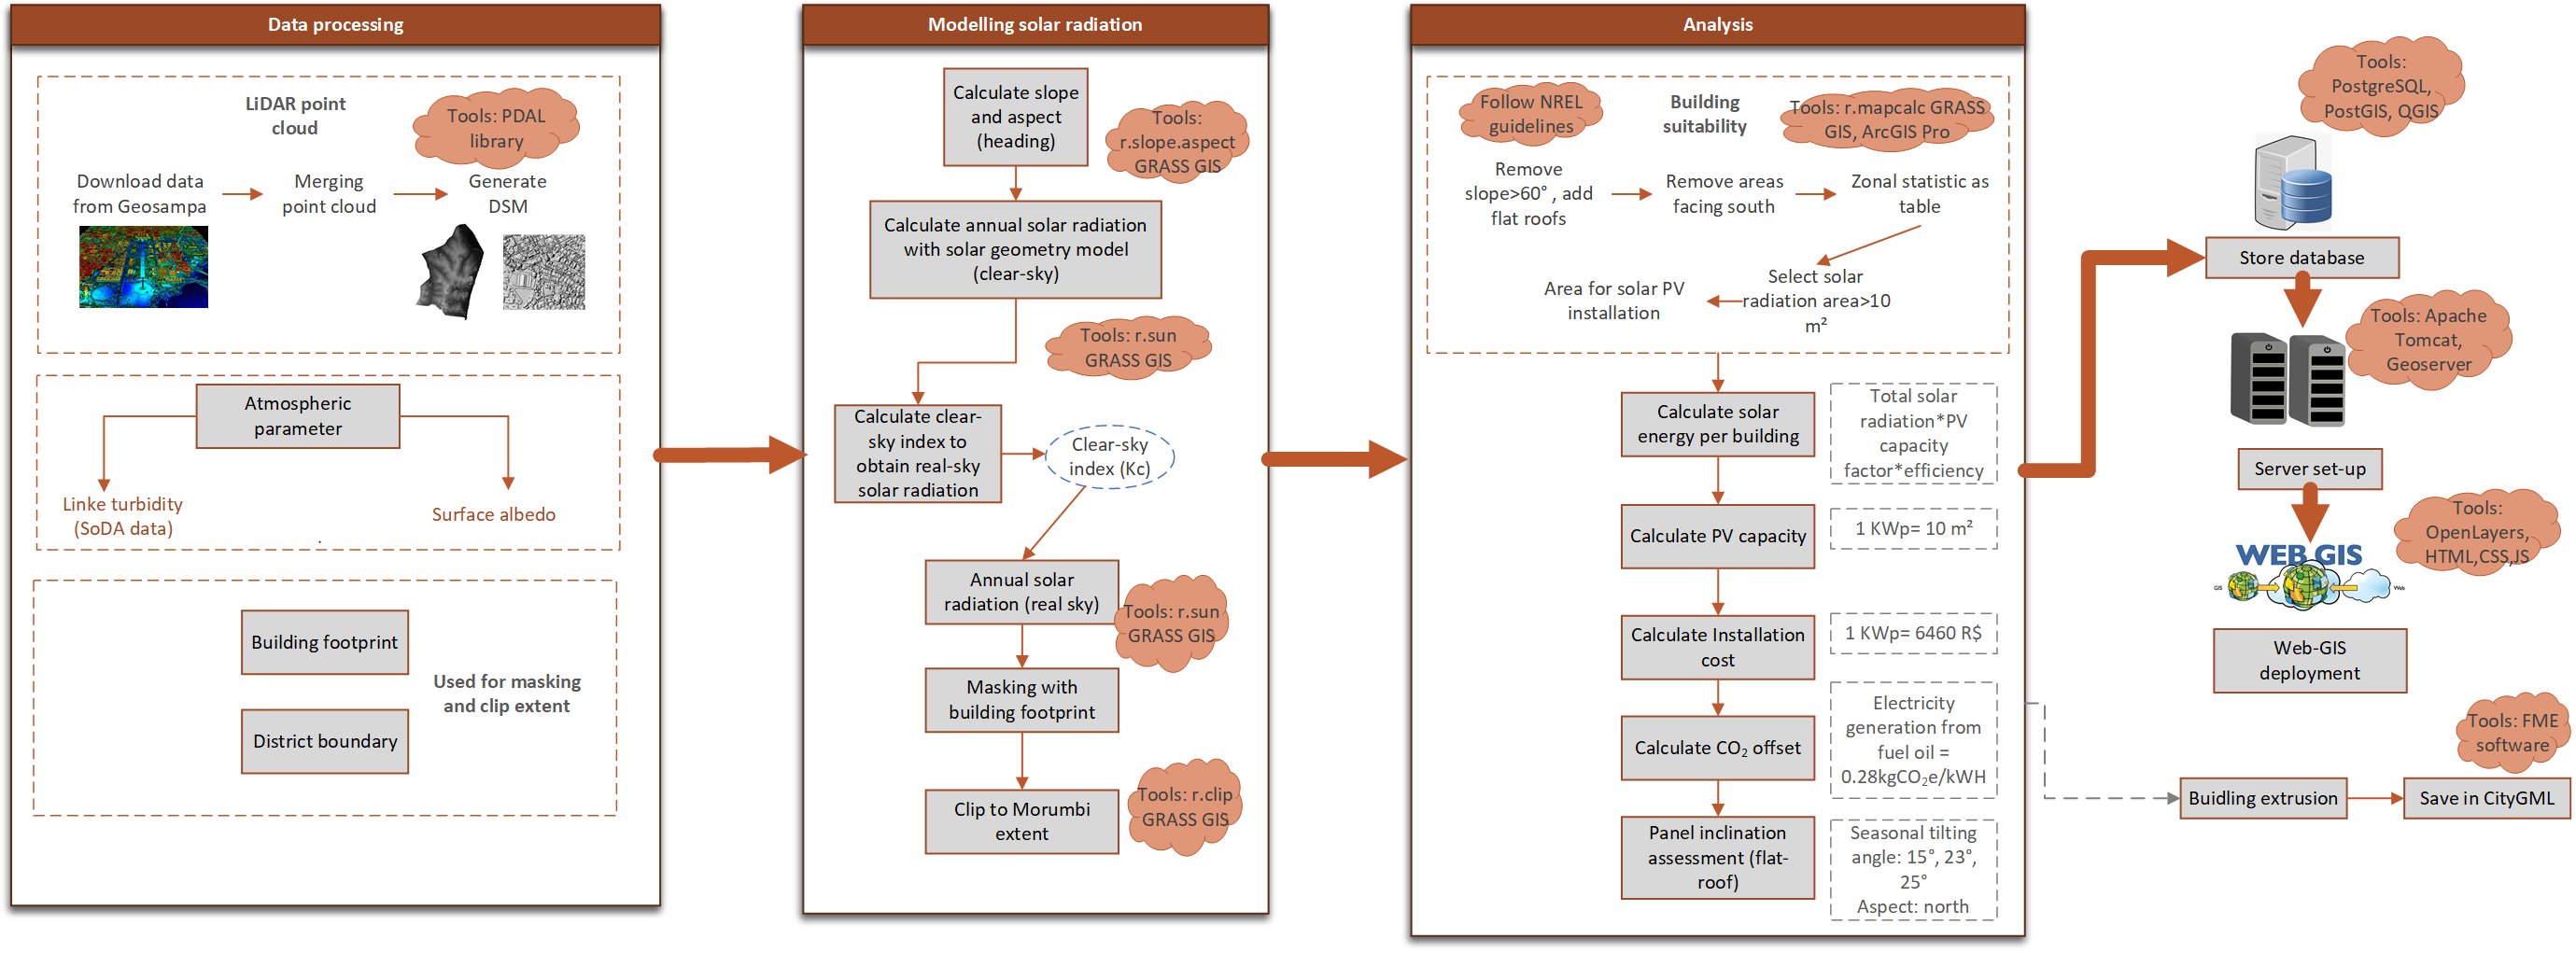