Based on the methodology used in the previous section, an interactive web-based application was developed.
The application can be accessed at this link.
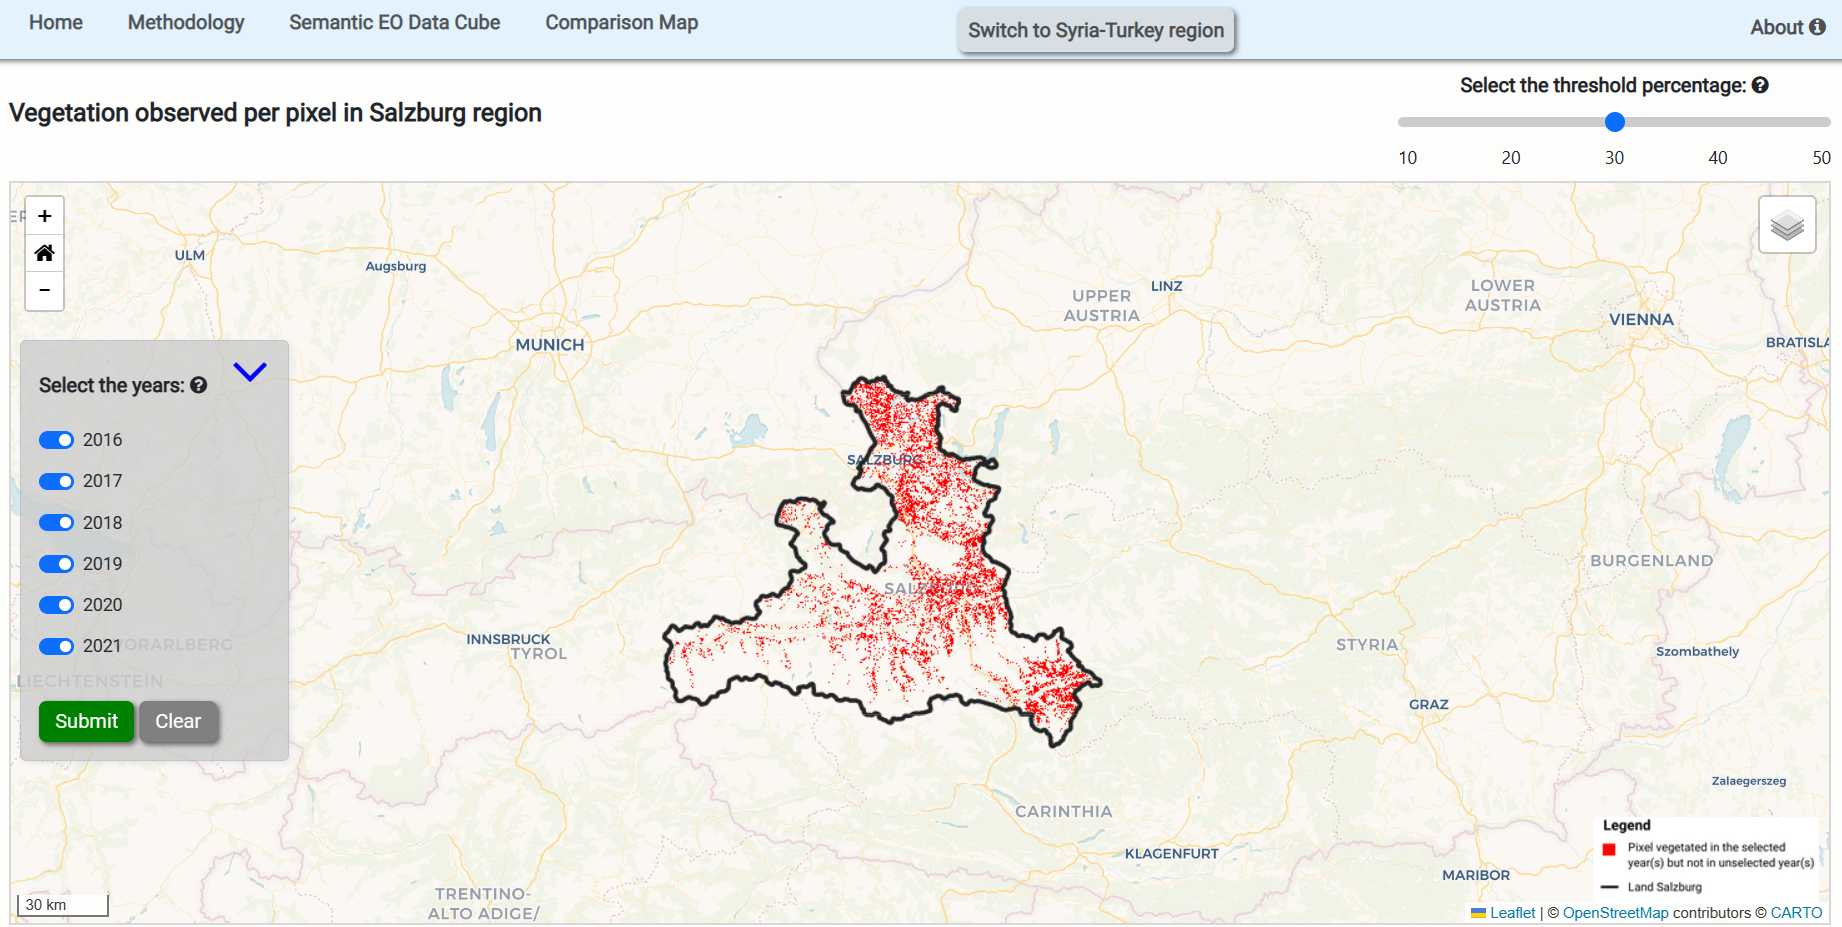
Vegetation occurrence in Salzburg region
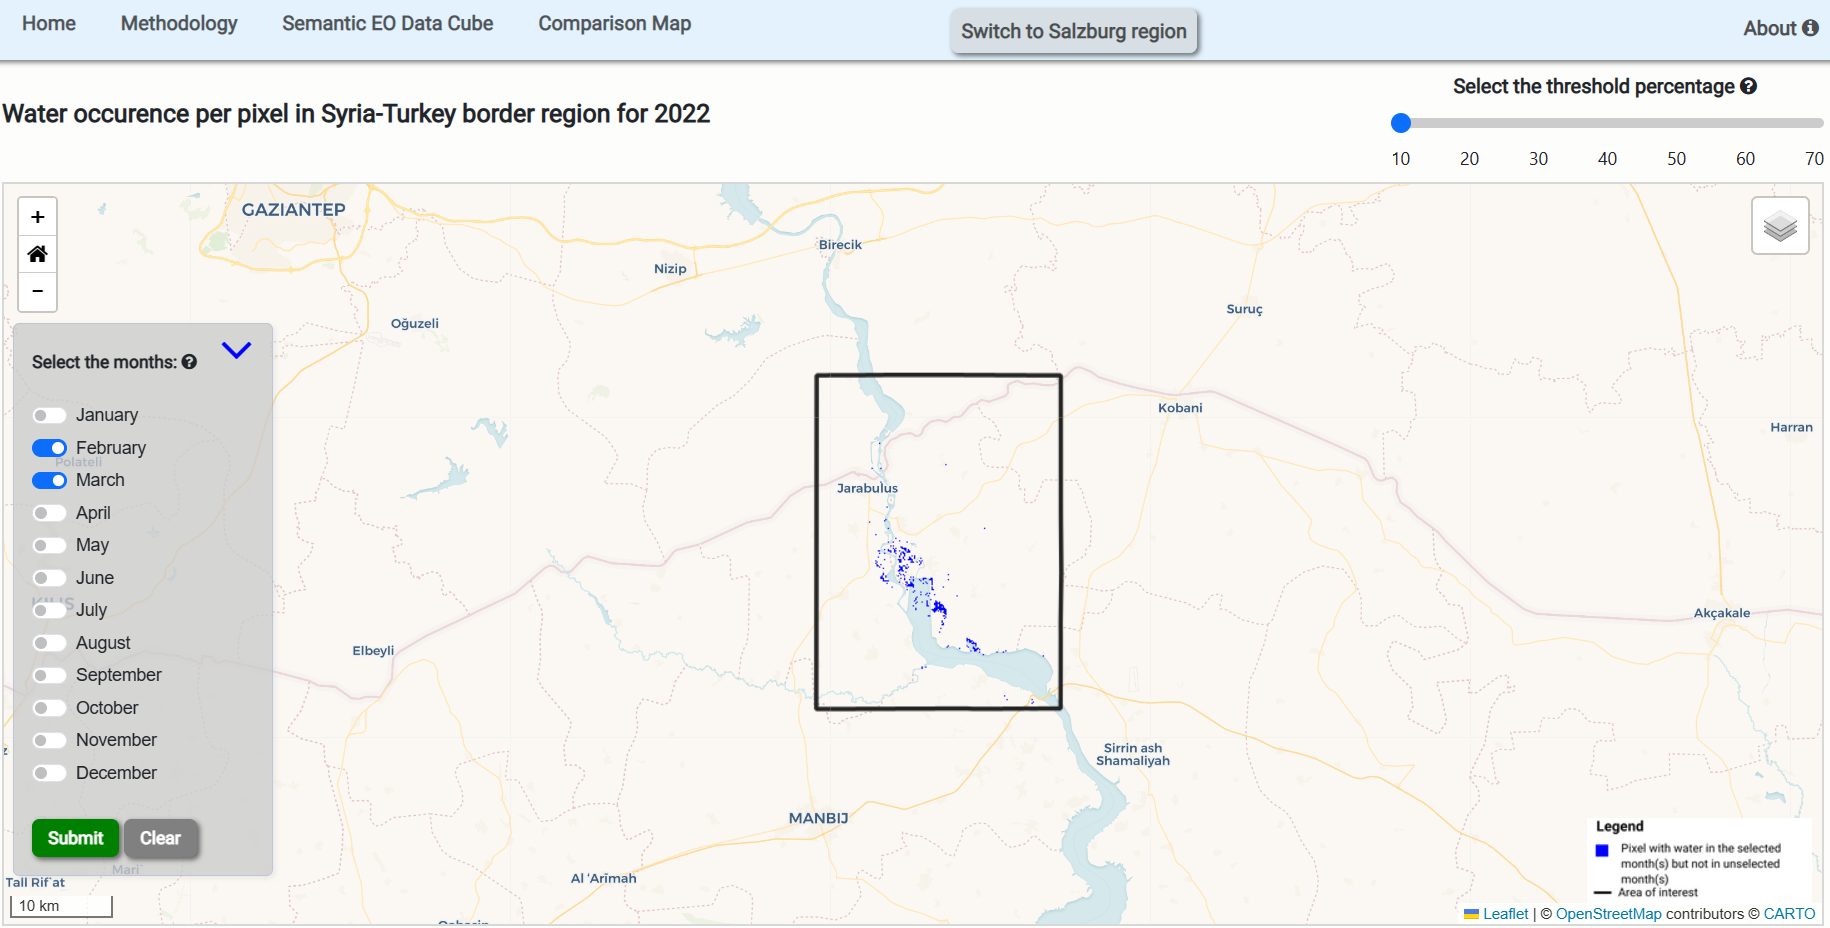
Water occurrence in northwestern Syria
Users can select the threshold percentage and years (in Salzburg) or months (in
Syria) based on their
interests. The pixels that are unique to that selection will be visualized on the map. In the
Comparison
Map section, users can select two or more time period, and the dynamics in those period can be
seen
through two side by side maps.
User evaluation
A user evaluation based on survey questionnaires was performed to test the usability of the created web application.
The focus of the evaluation was to understand if the information in the map can be interpreted by the users and also get feedback on cartographic and other components of the web application.
16 participants took part in the user evaluation where both subjective and objective questions were included.
While most of the users liked the visualization approach and the elements in it, some of the
participants felt necessary for more comprehensive documentation about the approach with
interesting
examples, improvement in the interface and speed of the application.
Conclusion
GIS softwares and modern web technologies can be combined to offer interactive ways to present and assist users to understand multi temporal information. However, considerations should be taken on the user-friendly interface and overall usability of the application.