The production and availability of earth observation data have surged in the past two decades due to the introduction of free and open data policies in their distribution and technological advancements in terms of data acquisition, analysis and storage. We have come a long way since the launch of Landsat-1 in 1972. Humongous amount of Earth observation data has been produced so far.
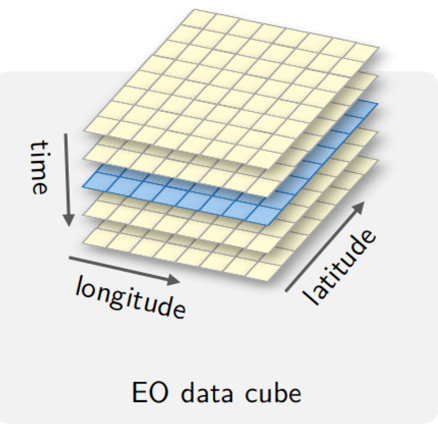
The traditional approaches of handling EO data is being replaced by the use of ‘data cubes’, a multi-dimensional array based concept that provides analysis ready data to the users. However, the pixels in itself do not have any meanings on their own.
Semantic EO data cubes go one-step ahead of the state of the art EO data cubes by associating
some
meanings from the real world to each observation in the data.
Human beings are more adaptable to recognize visual patterns. A good visualization can convey complex information to users in a simpler way and helps users to understand the depth and nuances of the data.
Maps are the most common form of representing spatial information. Web technologies like HTML, CSS and JavaScript are often combined with other technologies to create visualization on the web. The trend of visualizing geospatial information on the web in the form of maps and/or other similar visualization is growing for some time now.
In computer or other digital devices, RGB colour space is the most commonly used colour model. Different colours can be created by mixing three primary colours Red, Green and Blue.
When rasters containing information in multiple bands are represented in softwares like QGIS and ArcGIS Pro, three primary colours will represent information in three bands and mixed colours will represent information common to two or more bands. With multi-temporal EO data, usually there is information contained in more than three bands. Representing the complete temporal information in this manner is a challenge.
In regard to this problem, the thesis tries to explore the possibilities of combining both desktop and web based technologies to visualize the multi-temporal information obtained from semantic EO data cube. But, the multi-temporal information from any other source can be visualized in a similar manner.