Data and study area
The multi temporal information used in the thesis is the yearly percentage of vegetation observed per pixel in the Salzburg region of Austria for six years from 2016 to 2021 and the monthly percentage of water occurrence for the northwestern part of Syria for 2022. The information was obtained from Sen2Cube.at
Methods and softwares
Investigating the available GIS softwares and web development technologies, a thorough workflow was designed for each of the following steps:
- Pre processing the multi temporal information to prepare it for subsequent steps
- Hosting the pre processed rasters storing multi temporal information
- Developing the interactive web application for visualization
- Hosting the application
- User evaluation
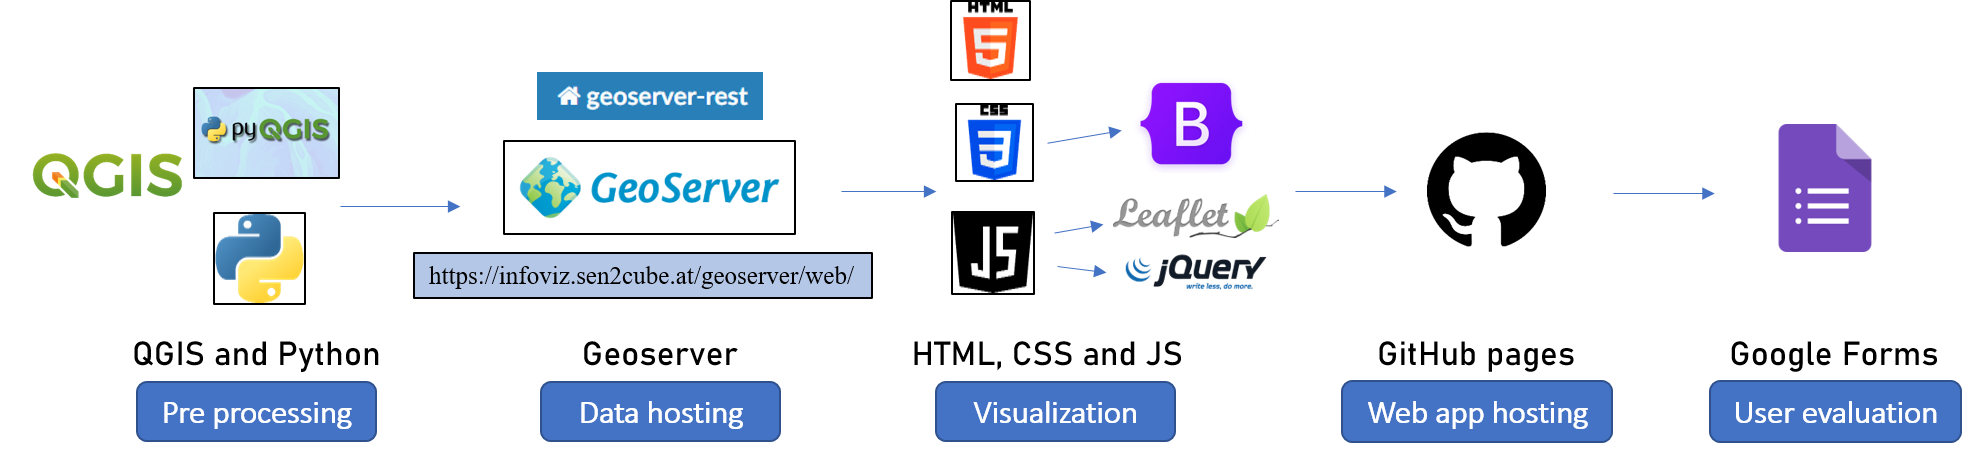
For the pre-processing step, PyQGIS, Python environment inside QGIS, was mainly used. It helps with the automation of QGIS processing algorithms yielding greater efficiency.
The processed rasters and their style files were hosted in a remote Geoserver. The link for the Geoserver can be seen in the figure above.
The interactive web map application was developed primarily with HTML, CSS and JavaScript. Leaflet was used as the mapping library. The rasters stored in GeoServer were served to the front-end using Web Map Service (WMS), an OGC standard for serving georeferenced map images.
Lastly, user evaluation based on survey was carried out.
Most of the technologies used in the thesis were free and/or open source.