SUMMARY
The name of bachelor thesis is Cartography of development of Czech Hydrometeorological Institute stations. The aim of the thesis was create a proper cartographic visualization and research the representativeness of the station network.
I received an excel data with information about stations: ID, date of begin/end, type, name and coordinates. I had to set an coordination system to the data in ArcMap 10.4 software. I started work with the data after. I had to delete some incomplete data which missed coordinates information or date. I split the data by the years of begin/end and by the type of the station (meteorological, climatological, pluviometric, automatic, manual). I got data how to create static and dynamic maps. With proper cartographic tools, ArcMap and graphic softwares I made them.
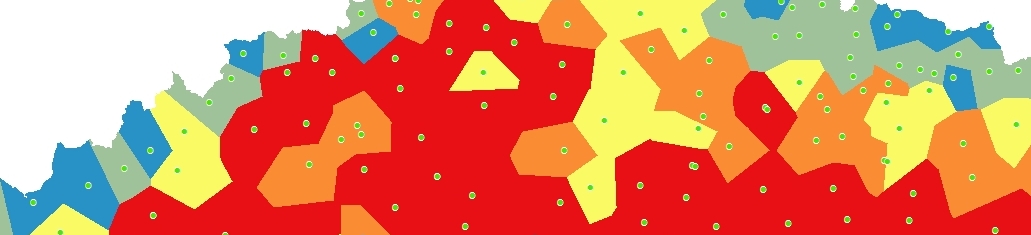
The second part of the thesis was little bit harder. I joined the information about the area to the data/stations. First was Landuse (5 categories - urban areas, agriculture, forest, water bodies, mixed areas), second was climatic areas by Quitt included several values from cold to warm. The third area information was geomorphology included 17 categories. These area information was joined together into the new attribute named Type. This Type was clustered in the WEKA software and I've got 5 clusters which are shown in the map of representativeness.
This thesis gives us a new way how to study meteorology. Now we can study where is important to build a new station, which station is important to automatize or which station isn't needed anymore.