HTML5 Icon   COPERNICUS DATA IN SUSTAINABLE DEVELOPMENT GOALS USING IMAGE MAPS   HTML5 Icon


Introduction

The world today confronts a range of arduous global issues such as climate change, pandemics, food insecurity, water contamination, biodiversity loss, socioeconomic disparities, political discord and other related complications. In order to address such global challenges and achieve better and more sustainable future for all, the UN member states adopted the global agenda of Sustainable Development Goals (SDGs) in 2015. With the joint commitment and collaborative effort of 193 countries, the global agenda of SDGs aims to foster sustainability of actions in ending poverty alongside promoting economic growth and addressing social needs like education, health, and job opportunities while tackling climate change and protecting terrestrial and marine ecosystems.

The development of Global Indicator Framework for monitoring the progress towards SDGs is predominantly based on statistical information. However, it has been well acknowledged that geospatial information, encompassing geographic location and spatial context, is a valuable asset for enhancing the efficacy of the framework. This inclusion can offer important insights into the spatial aspects of development trends and aid in monitoring progress on a localized level to facilitate the targeted interventions. Earth Observation (EO) plays a pivotal role as a prominent data source in elucidating various environmental dimensions of our planet. In addition, it serves as a crucial spatial disaggregation mechanism for a multitude of SDG indicators (ESA, 2020).

Maps have the capability to simplify complex information and unveil spatial patterns that otherwise remain unnoticed. They play an important role in showcasing spatio-temporal trends in worldwide population, socioeconomic inequalities, and alterations in climatic conditions. Well-designed cartographic representations facilitate the monitoring of SDG indicators and enable effective communication of their disproportionate global footprints (Kraak et al., 2020). Such visualizations serve to aid the decision-making processes of both local and national governing bodies, while concurrently augmenting public consciousness of global issues and urging the action to be taken by the concerned authorities.

This research aims to demonstrate the power Copernicus as an earth observation platform in managing and monitoring SDG indicators through the innovative use of image maps. 15 most relevant SDG indicators have been visualized using the datasets from five of the Copernicus Services using two different prototypes of thematic image maps. In addition to cartographic visualizations, the thesis also deals with analysis and interpretation of individual image maps along with methodical description on how to create and use image maps to solve the corresponding SDGs. The results have been transformed into a set of information products in five different cartographic formats following a unique concept of geovisualization. Overall, the thesis offers a holistic approach in integrating earth observation and cartography for managing SDGs and thereby, highlights the crucial role Copernicus data can play in evidence-based decision making in SDG context.

Objectives

The main goal of the thesis is to design and compile a set of image maps from the data of the Copernicus project and thereby demonstrate the applicability of satellite data to support solutions to the selected Sustainable Development Goals (SDGs).

The sub-goals of the thesis can be as divided as follows:

  •     • To monitor the progress of selected SDG indicators over space and time
  •     • To present different prototypes of image maps and their suitability in visualizing the SDG indicators
  •     • To demonstrate a concept of geovisualization utilizing different forms of cartographic information products

The research aims to fulfil the geospatial information requirements pertaining to the measurement and monitoring of the selected SDG targets and indicators. This allows to enhance the accessibility, availability, and utilization of Copernicus as a free and open-source earth observation data, with a view to foster sustainability at a planetary level. The concept encourages inclusive and harmonized collaboration with a deeper understanding of how the integration of earth observation together with cartography can enable the accurate assessment of the advancements made towards the specific SDGs.

Different categories of target audience will be able to derive considerable benefits from the present research, particularly those who lack awareness about the prospects of earth observation in the context of the SDGs. The results of the thesis will be richer in information content and will allow the users to experience dynamics and interactivity within map environment. More importantly, the research outcomes will serve to assist the policy makers in informed decision making and effective policy formulation with a rationale that an incremental progress towards the SDG targets will be achieved in due course.

Methodology

workflow

Conclusion

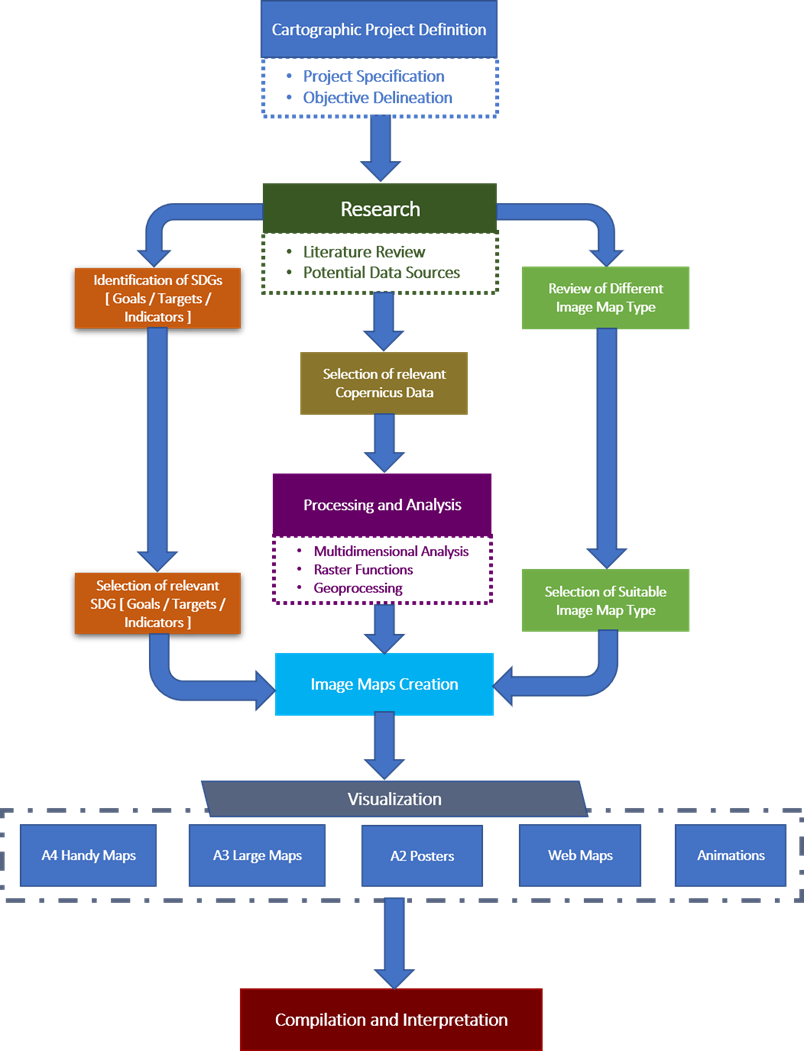
The thesis was successful in meeting the set objectives of demonstrating the applicability of Copernicus data in devising solutions to the Sustainable Development Goals. 15 thematic image maps depicting the selected SDG topics were designed and compiled by utilizing the data from five of the Copernicus services. The image maps were subsequently transformed into five sets of different cartographic information products: A4 handy maps, A3 large maps, A2 posters, web maps and animations, each of these oriented towards a specific purpose and target audience. A unique concept of geovisualization was implemented by utilizing these formats to effectively communicate the mapped information to each group of target audience.


The application of multidimensional analysis on Copernicus data facilitated in detecting meaningful trends, patterns and interlinks that occurred in the datasets. This was useful for deciding which data of what location and which time period was more appropriate for mapping the selected SDG topics. The analysis of temporal profile of variables enabled the study of change in distribution of values over a time period. Multidimensional tools were also helpful in creating map animations where the data frames of the subsets and aggregations of different variables were used to visualize the temporal change in distribution of data. Such analysis can play a pivotal role in the routine monitoring of SDG indicators, thereby helping to track their progress by determining whether we are moving towards the goal or away from it.


The research has successfully fulfilled the geospatial information requirements pertaining to the measurement and monitoring of the selected SDG targets and indicators. The use of image maps in SDG context proved to be a decent approach in mapping the selected topics. The image and symbol components of the designed thematic image maps perfectly complemented each other, and allowed for overcoming the limitations of one component by the other and vice versa. Proper harmonization of image and symbol components enabled better visualization and effective communication of the mapped phenomena to the intended audience.


The research has revealed the potential of Copernicus data in supporting solutions to selected SDGs. This has allowed for the enhancement of accessibility, availability, and utilization of Copernicus as a free and open-source earth observation data, with a view to foster sustainability at a planetary level. The thesis has offered a holistic approach in integrating earth observation and cartography for managing the SDGs, thereby highlighting the crucial role Copernicus data can play in evidence-based decision making in the SDG context. The research outcomes will serve to assist the policy makers in informed decision making and effective policy formulation with a rationale that an incremental progress towards the SDG targets will be achieved in due course of time.