Introduction
Hiking is a popular outdoor activity that has increased in popularity in recent years, with more and more people looking for new and exciting places to explore. Hiking is a recreational activity that involves walking or trekking in natural environments, such as mountains, forests, and parks. The popularity of hiking has grown in recent years due to its health and environmental benefits, as well as its social aspect, allowing people to connect with nature and with each other. With the advent of technology, hikers now have access to a wide range of tools and applications that help them plan, track and share their hiking activities. One of the features of these platforms is the online visualization of hiking activity.
Online visualization is used in hiking to provide real-time information about the hiker's location, speed, altitude, and other key parameters. This information is displayed on a digital map, which allows hikers to monitor their progress and make informed decisions about their route. In addition, online visualization provides a visual representation of the data, making it easier for hikers to understand and interpret. This visualization can also be used to compare different routes and to find the best path for a specific type of hiking activity, such as backpacking or mountain climbing.
The idea is creating a web-based platform to visualize interactively simulated hiking activities that will help the new (in the city) hikers decide their hiking paths, energy requirements, and place-making/ scenic/ resting locations. This web application will also be helpful for the urban local bodies to take a look at potential hiking-based tourism activities by analysing the hotspot locations in between the hiking trails.
The use of online visualization in hiking provides several benefits for hikers, including:
1. Improved Safety: Online visualization allows hikers to monitor their progress and track their location in real-time. This helps to reduce the risk of getting lost or stranded and can be particularly useful in remote areas.
2. Better Route Planning: Online visualization provides a visual representation of the hiking route, making it easier for hikers to plan their route and find the best path for their activity.
3. Increased Awareness: Online visualization can be used to display key data about the hiker's performance, such as speed, altitude, and distance travelled. This information can help hikers to become more aware of their physical condition and make adjustments to their route accordingly.
4. Sharing Experiences: Online visualization also allows hikers to share their experiences with others. Hikers can share their routes, performance data, and photos with friends and family, allowing others to experience their adventure.
From the implementation point of view, both 2D and 3D scene are placed along with the hiking paths and point location of the scenic location and resting place. The data will be a combination of both vector and raster so that it can have more feasibility for the implementation purpose and vector data would be a combination of OSM and self-prepared/ observed paths and point location. The energy simulation will be based on a colour theme as a general hiking requirement. During the testing, observe how participants interact with the visualization and take note of any issues or problems they encounter. Encourage participants to think aloud as they use the visualization, so you can get insight into their thought processes and decision-making.
References
Fu, P., & Sun, J. (2011). Web GIS: principles and applications (pp. 89-114). Redlands: Esri Press.
Hajdú, E., & Pál, M. (2021, December). The digital cartographic reconstruction of the 1897 ‘Mátra Guide’(Hungary). In Proceedings of the ICA (Vol. 4, p. 42). Copernicus GmbH.
Kraak M.J., Brown A. (2003). Web Cartography: Developments and Prospects.
Muehlenhaus I. (2013). Web Cartography: Map Design for Interactive and Mobile Devices.
Nétek, R. (2020). Webová kartografie – specifika tvorby interaktivních map na webu. Univerzita Palackého v Olomouci. 196 s. ISBN 978-80-244-5827-4.
Pedaste, M., & Sarapuu, T. (2006). Developing an effective support system for inquiry learning in a webbased environment. Journal of computer assisted learning, 22(1), 47-62.
Varjú, V., Suvák, A., & Dombi, P. (2014). Geographic Information Systems in the service of alternative tourism–methods with landscape evaluation and target group preference weighting. International Journal of Tourism Research, 16(5), 496-512.
Aim
The aim of the thesis is to create a web-based platform for hiking activities, which will help the potential hikers to analyse their hiking track by various assessment parameters.
Objective
Visualizing 3D terrain and its factors is crucial and widely used. It has huge potential for better serving humanity using GIS applications.
An online hiking visualization aims to show users their trails, distance, and elevation for tracking progress, planning hikes, and sharing experiences. It may also provide information on popular routes, trail conditions, and weather to aid hike planning. Online visualization also offers insights into usage patterns (e.g., popular times and trails) to help park managers and organizations plan outdoor recreational spaces.
Online visualization refers to the display of data and information in a visual format through the use of digital tools and platforms. This can include interactive maps, charts, and graphs. By using online visualization, park managers and organizations are able to gain valuable insights into usage patterns of outdoor recreational spaces, such as the most popular times and trails. This information can help inform decision-making around resource allocation, infrastructure development, and overall planning of these areas. The visual representation of data and information can also assist in effectively communicating these insights to stakeholders, promoting informed decision-making and collaboration.
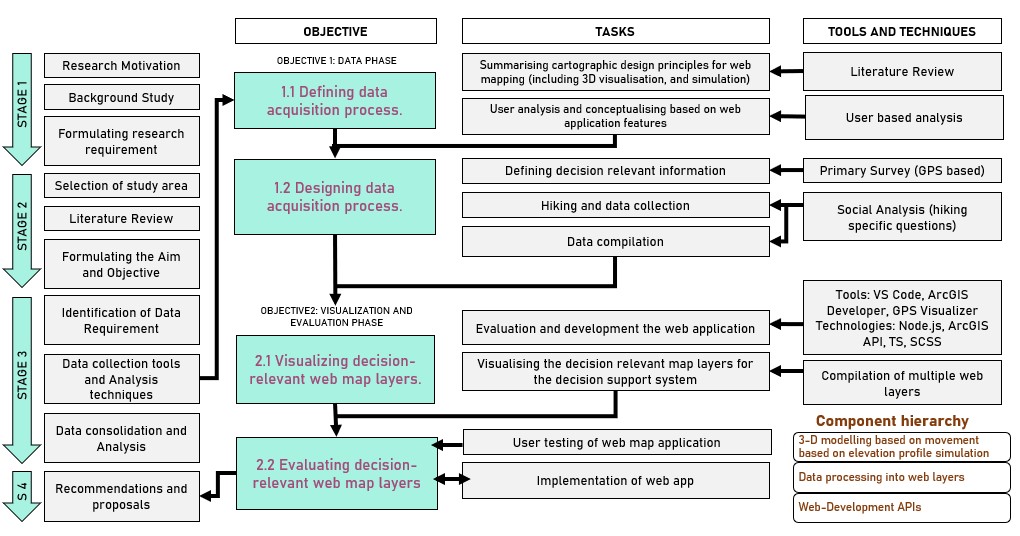
The overall aim is further divided into two major objectives: “Data Phase” and “Visualization and evaluation phase”
I. Data phase: objective I
„Defining and designing the data acquisition process.“
Research questions:
a) For a decision support system aimed at travelers who are interested in hiking, what information is pertinent to make informed decisions?
b) Which APIs are suitable and applicable to a hiking-focused decision support system, and what requirements must the APIs meet?
II. Visualization and evaluation phase: objective II
„Visualizing and evaluating decision-relevant web map layers.“
Research questions:
a) What are the available web mapping applications, and how do they aid in the decision-making process for travelers?
b) What are the optimal design features for map elements to best assist travelers in their decision-making process?
Methodology
The overall methodology is based on achieving two objectives, and for that, it requires specific steps, tasks, tools, and techniques. The first methodology is completely focused on the data acquisition, compilation, and spatial visualization strategy, while the second methodology is more centered around the development, visualization, and evaluation processes delatied described in Methodology flow chart below.
Client-Side User Interface
UI Elements
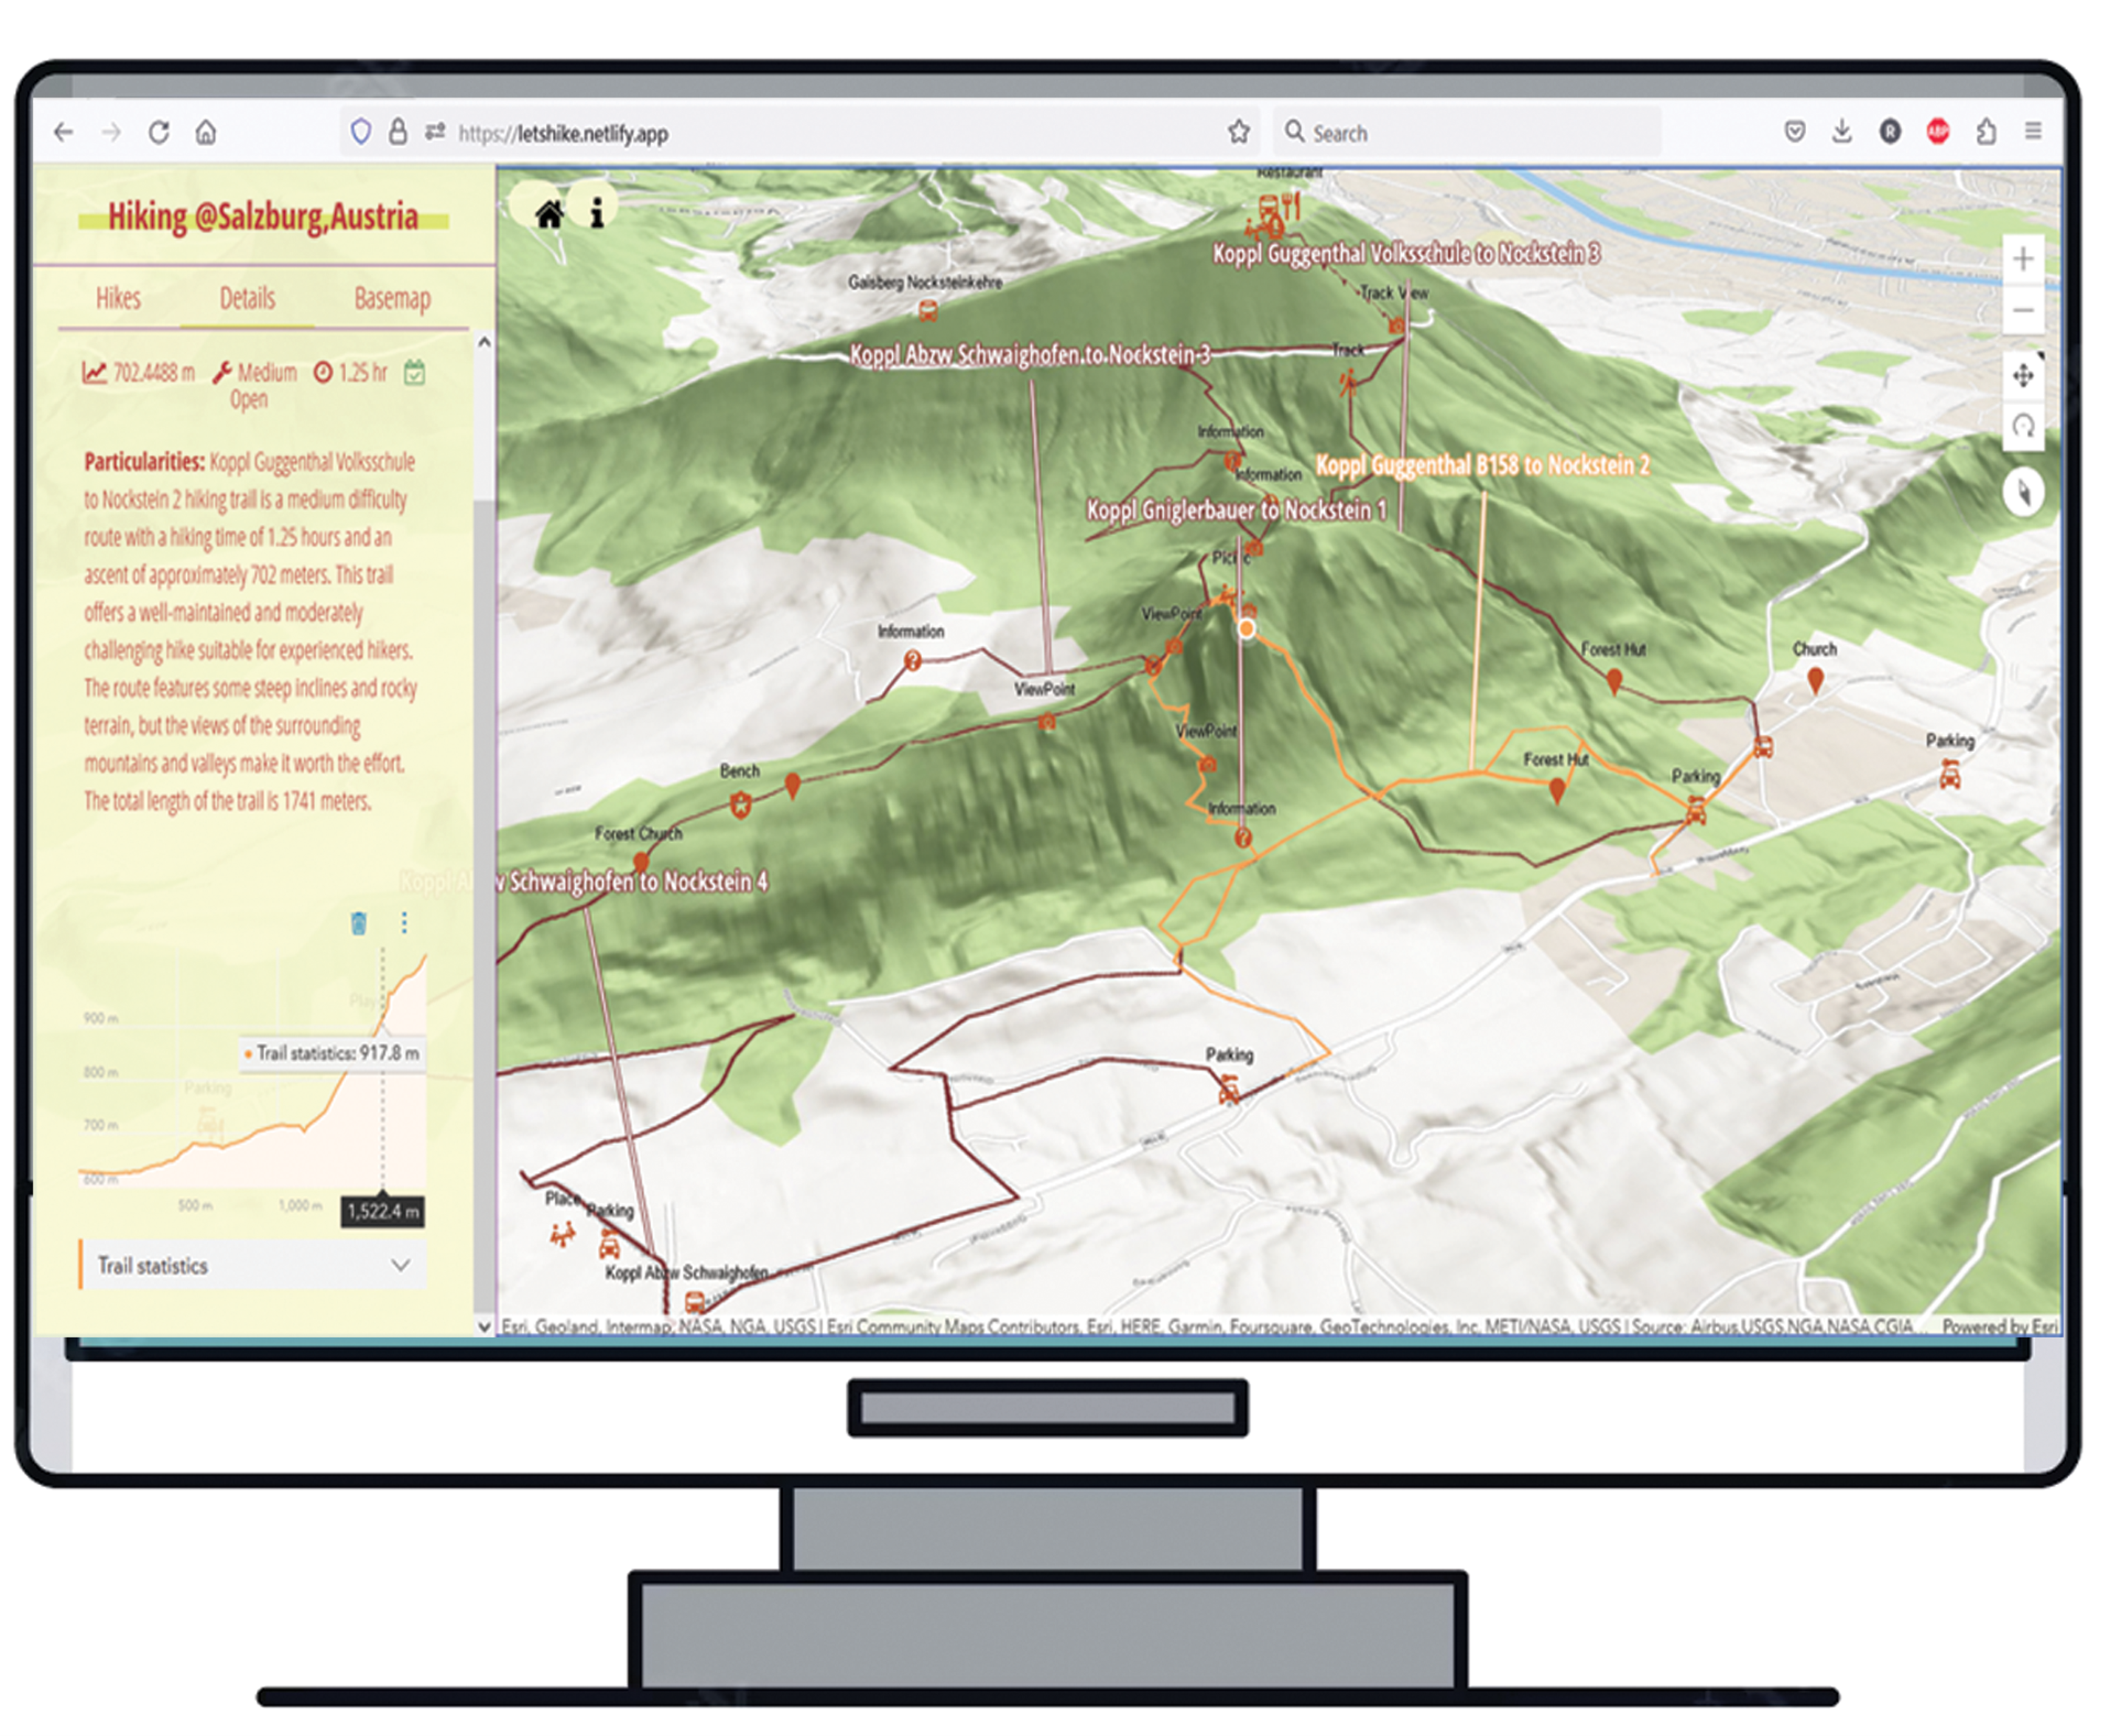
This web application for hiking allows users to search and discover hiking trails near their location. The UI (User Interface) of the website is designed to be simple, intuitive, and easy to navigate, making it user-friendly for both experienced hikers and beginners. Here are some of the UI elements of the hike application:
• Header: The header of the website contains the title of the trail unit(s).
• Navigation Bar: Below the header, there is a navigation bar that contains links to different sections of the website, including Home, Trails, About, and Contact.
• Trail Cards: The main section of the website displays a grid of trail cards, each representing a different hiking trail. The trail cards contain information such as trail name, location, difficulty level, distance and other specifications. Users can click on a trail to view more details about the trail.
• Filters: On the left-hand side of the trail cards, there are filters that allow users to refine their search based on difficulty level, distance, rating, and features such as dog-friendly or wheelchair accessible.
• Trail Details: When a user clicks on a trail card, they are taken to a new page that displays more information about the trail, including a map, trail description, photos, and reviews.
• Back Button: On the trail details page, there is a back button that allows the user to easily navigate back to the previous page.
• Added Values: It contailslinks to web-app collaborations, as well as a copyright notice and disclaimer.
Access the web application
Evaluation of Prototype
For the evaluation a survey was conducted that people take online. The survey is based on pictures of a prototype, which is a rough draft of a product that is not fully functional yet. Participants are asked to pretend they are using the product as one of fourdifferent types of users.
The survey includes questions with pre-made answers that people choose from, like "pick the best option" or "rate how much you agree." These questions help gather information that is easy to compare and understand.
There are also questions where people can write their own answers in a text box, like "How many difficult trials can you access?" These questions allow people to share their own opinions and experiences, which can help improve the product.
Overall, this survey helps gather information about the prototype to make it better. It is important that the survey is well-designed and tested to make sure it gets the right information. The survey also uses two different types of users to make sure the results match what real users would want and need.
The overall questionairre was designed into three major sections:
• Section 1: General Questions
Questions about there basic details and about and their web mapping/ activity preferences
• Section 2: Visual expressions and evaluation
General questions about the interface, map contents, navigation and accessibility of the web application
• Section 3: Feedback and suggestions
Flexibility to write about their comment and additional suggestion about the app.
Conclusion
The development and testing of the web application for hiking trail planning have resulted in a successful and user-friendly platform for users to find and plan their hiking adventures. The application's intuitive user interface, search functionality, and integration of map layers have provided users with a seamless experience in discovering and exploring hiking trails. Through the implementation of modern web technologies, such as Node.js for both frontend and backend, the application was able to deliver a responsive and efficient platform. The use of libraries like Material UI and Google-map-react contributed to the overall user experience by providing well-designed UI elements and interactive map features.
The usability test conducted with a group of participants confirmed the effectiveness of the application. All participants were able to easily complete tasks such as searching for hiking trails and creating hiking plans. Their positive feedback highlighted the simplicity, intuitiveness, and usefulness of features such as the reviews and ratings system.
The integration of various map layers, including country boundaries, hiking trails, and places of interest, allowed users to visualize recommendations and plan their hikes effectively. The use of the ArcGIS Maps SDK for JavaScript and customization of basemaps using the Google Maps JavaScript API provided a visually appealing and informative map interface. The evaluation of the prototype through an online survey further validated the application's success. The feedback received from participants helped identify areas of improvement and provided valuable insights for future enhancements.
The main objective of the master thesis is to develop web-based tourism application that harnesses the potential of web-based geographic information systems (GIS) to enhance outdoor leisure experiences. The app is specially designed to help hikers plan tours based on their personal preferences and requirements. It contains a comprehensive range of information on hiking routes, public transport, parking, attractions, viewpoints and restaurants, all accessible through a user-friendly and interactive interface.
The application is developed using Node.js and the ArcGIS API (ArcGIS Maps SDK for JavaScript), which requires a significant level of programming skills, as well as knowledge of data science and database administration. Node.js is a popular back-end development platform, and the ArcGIS API is a powerful tool for geospatial mapping and analysis. Together, these technologies provide a solid foundation for the development of web-based GIS applications, such as the hiking application described in this research.
One of the main advantages of the application is that it is based on an open-source platform, which means that it is accessible to both users and developers. This availability ensures that the app can be updated and expanded over time as more trails and outdoor destinations are added to the database. In addition, the app uses 3D scene design to offer users a visually pleasing and immersive experience.
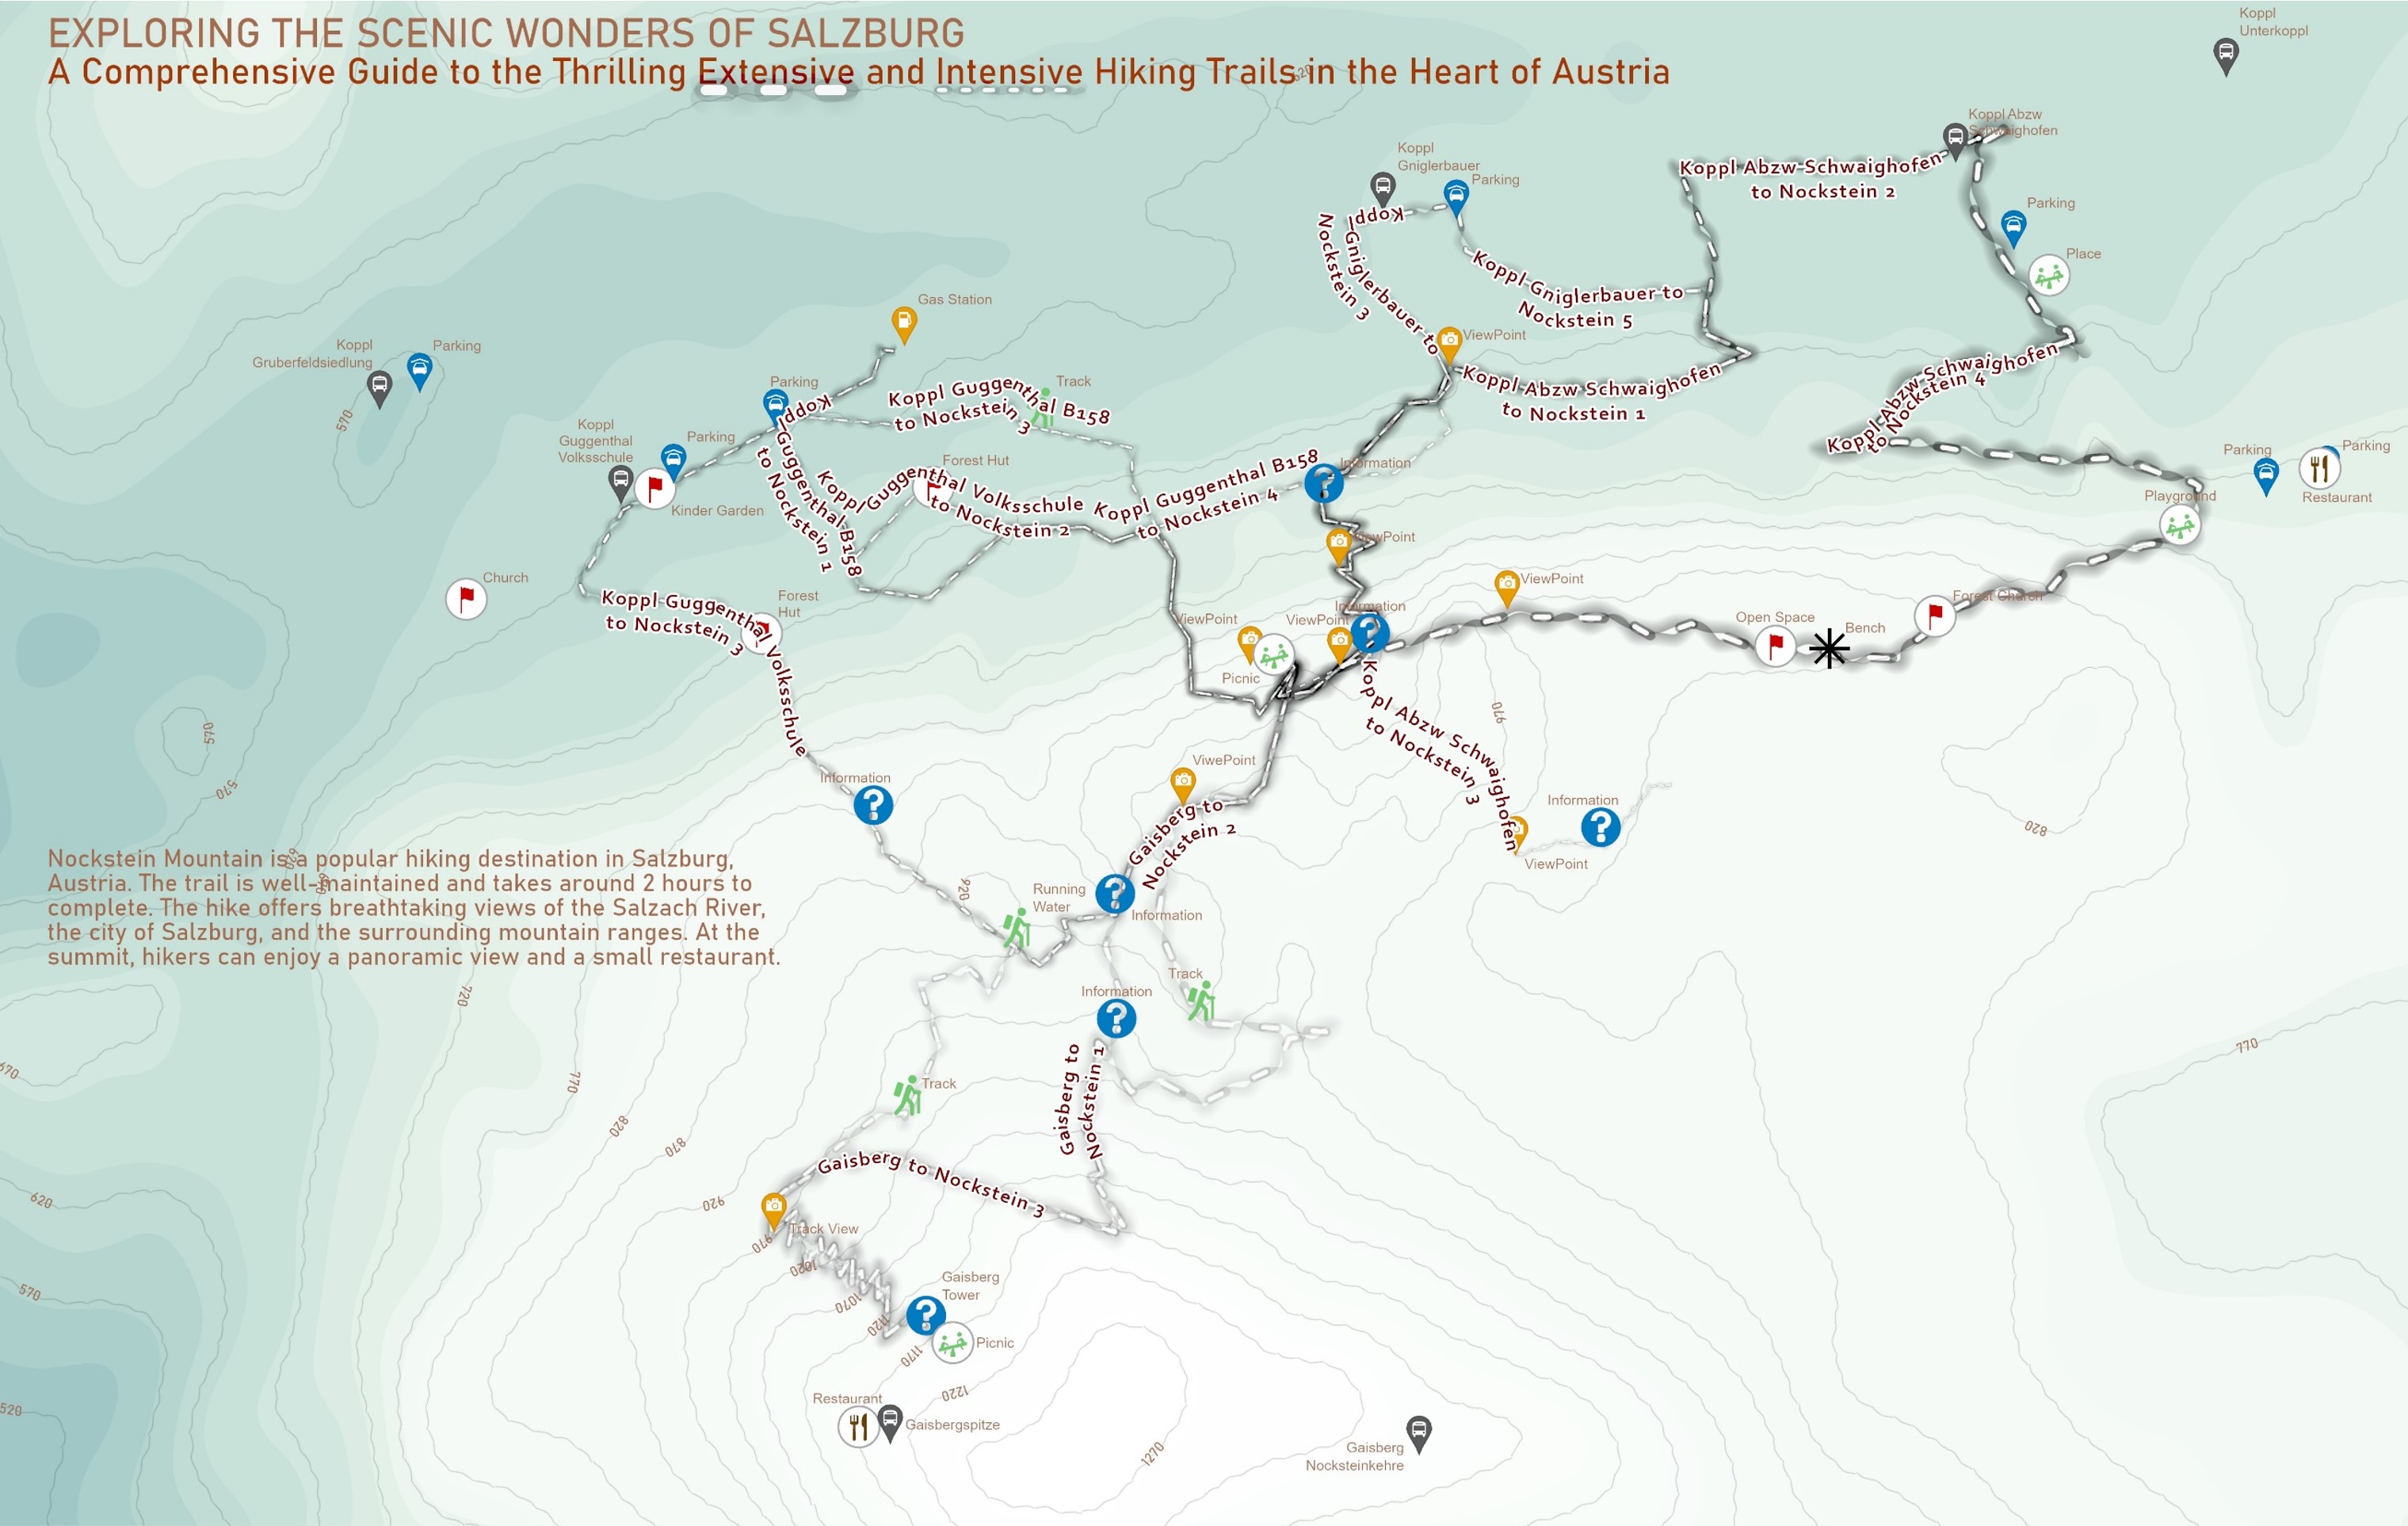
The study area for this application is the Nockstein and the Gaisberg in Salzburg, Austria. However, the app has the potential to expand globally, covering trails in different parts of the world. This hiking application is a testament to the potential of web-based GIS and a valuable resource for hikers looking to explore new trails and outdoor destinations. With this app, hikers can plan their hikes more efficiently, discover new trails, and enjoy safer, more enjoyable outdoor experiences.