Introduction
Urban Heat Islands (UHIs) and heat waves are some of the fastest-growing climate risks for cities. Between 2000 and 2019, heat contributed to roughly 489,000 deaths globally each year (UNDRR, 2026). Europe is warming faster than any other continent and the record-breaking heatwaves of June 2026 in Germany, Poland and the Czech Republic made this risk impossible to ignore (UNDRR, 2026; Guerreiro et al., 2018). In the Czech Republic, where more than 70% of the population already lives in cities, this is especially pressing for the elderly, who make up a growing share of residents (Krkoška Lorencová et al., 2018).
Although UHIs are among the most studied urban climate phenomena (Oke et al., 2017), most research still relies purely on physical measurements, overlooking how people actually experience heat. This thesis therefore combines satellite and sensor-based thermal data with participatory mapping results and socio-demographic data to build a more holistic persepctive of who is affected by UHIs in Olomouc and where.
Objectives
This thesis develops a transferable geospatial framework to assess UHI risk in Olomouc, Czech Republic, combining thermal, urban structure, socio-demographic and human perception data. It is guided by three main goals:
- Preparing and harmonizing all indicators within a common hexagonal spatial framework.
- Building and applying a UHI risk model based on hazard, exposure, sensitivity and adaptive capacity and validating it against independent sensor network data.
- Communicating the results through an interactive web mapping application that supports decision-makers in identifying priority zones for UHI mitigation and adaptation.
Study Area
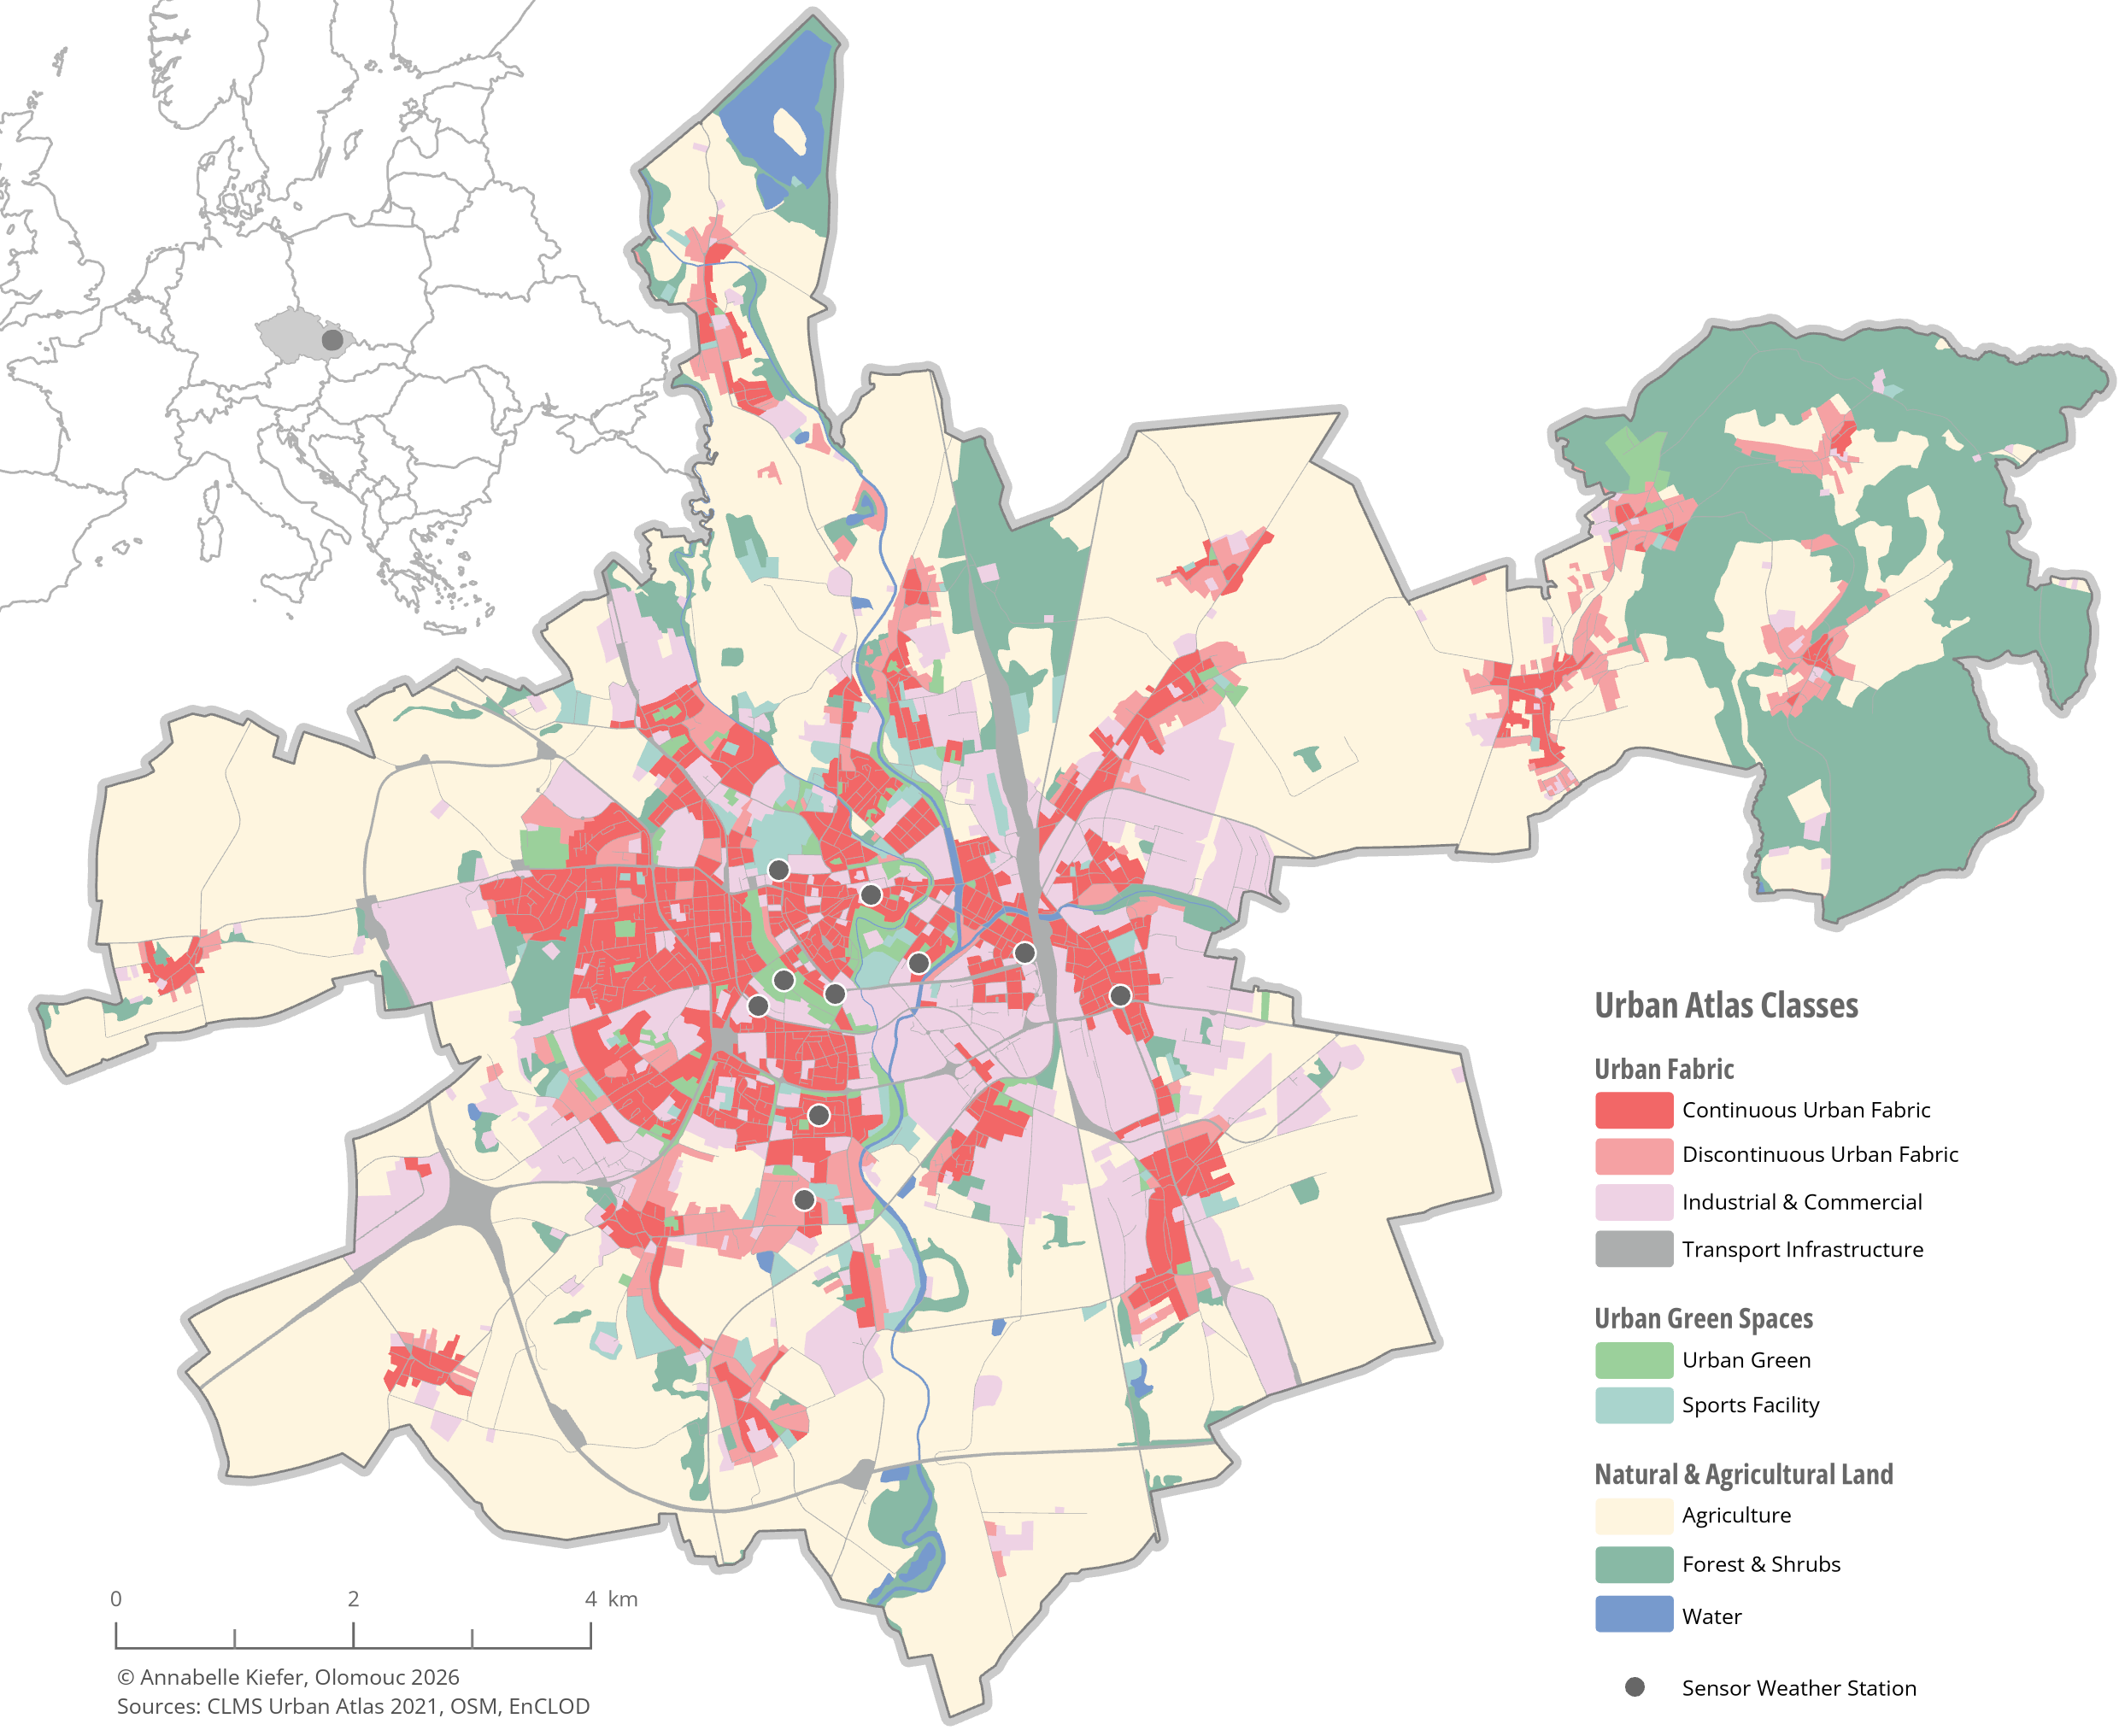
Olomouc is the sixth largest city in the Czech Republic, located in central Moravia, with around 103,000 inhabitants (CZSO, 2025). More than a third of its population belongs to vulnerable age groups, 16% are under 14 and 20% are over 65 (CZSO, 2021). The city covers 103 km², with a historic, densely built city center surrounded by a belt of parks, older apartment blocks and newer suburban development (Lehnert et al., 2021).
Methodology
All data was harmonized within a hexagonal grid (100 m side length), independent of administrative boundaries, to allow consistent comparison across the city. Each indicator was normalized to a 0–1 scale using min-max normalization, following the GIZ Vulnerability Sourcebook approach (GIZ, 2014).
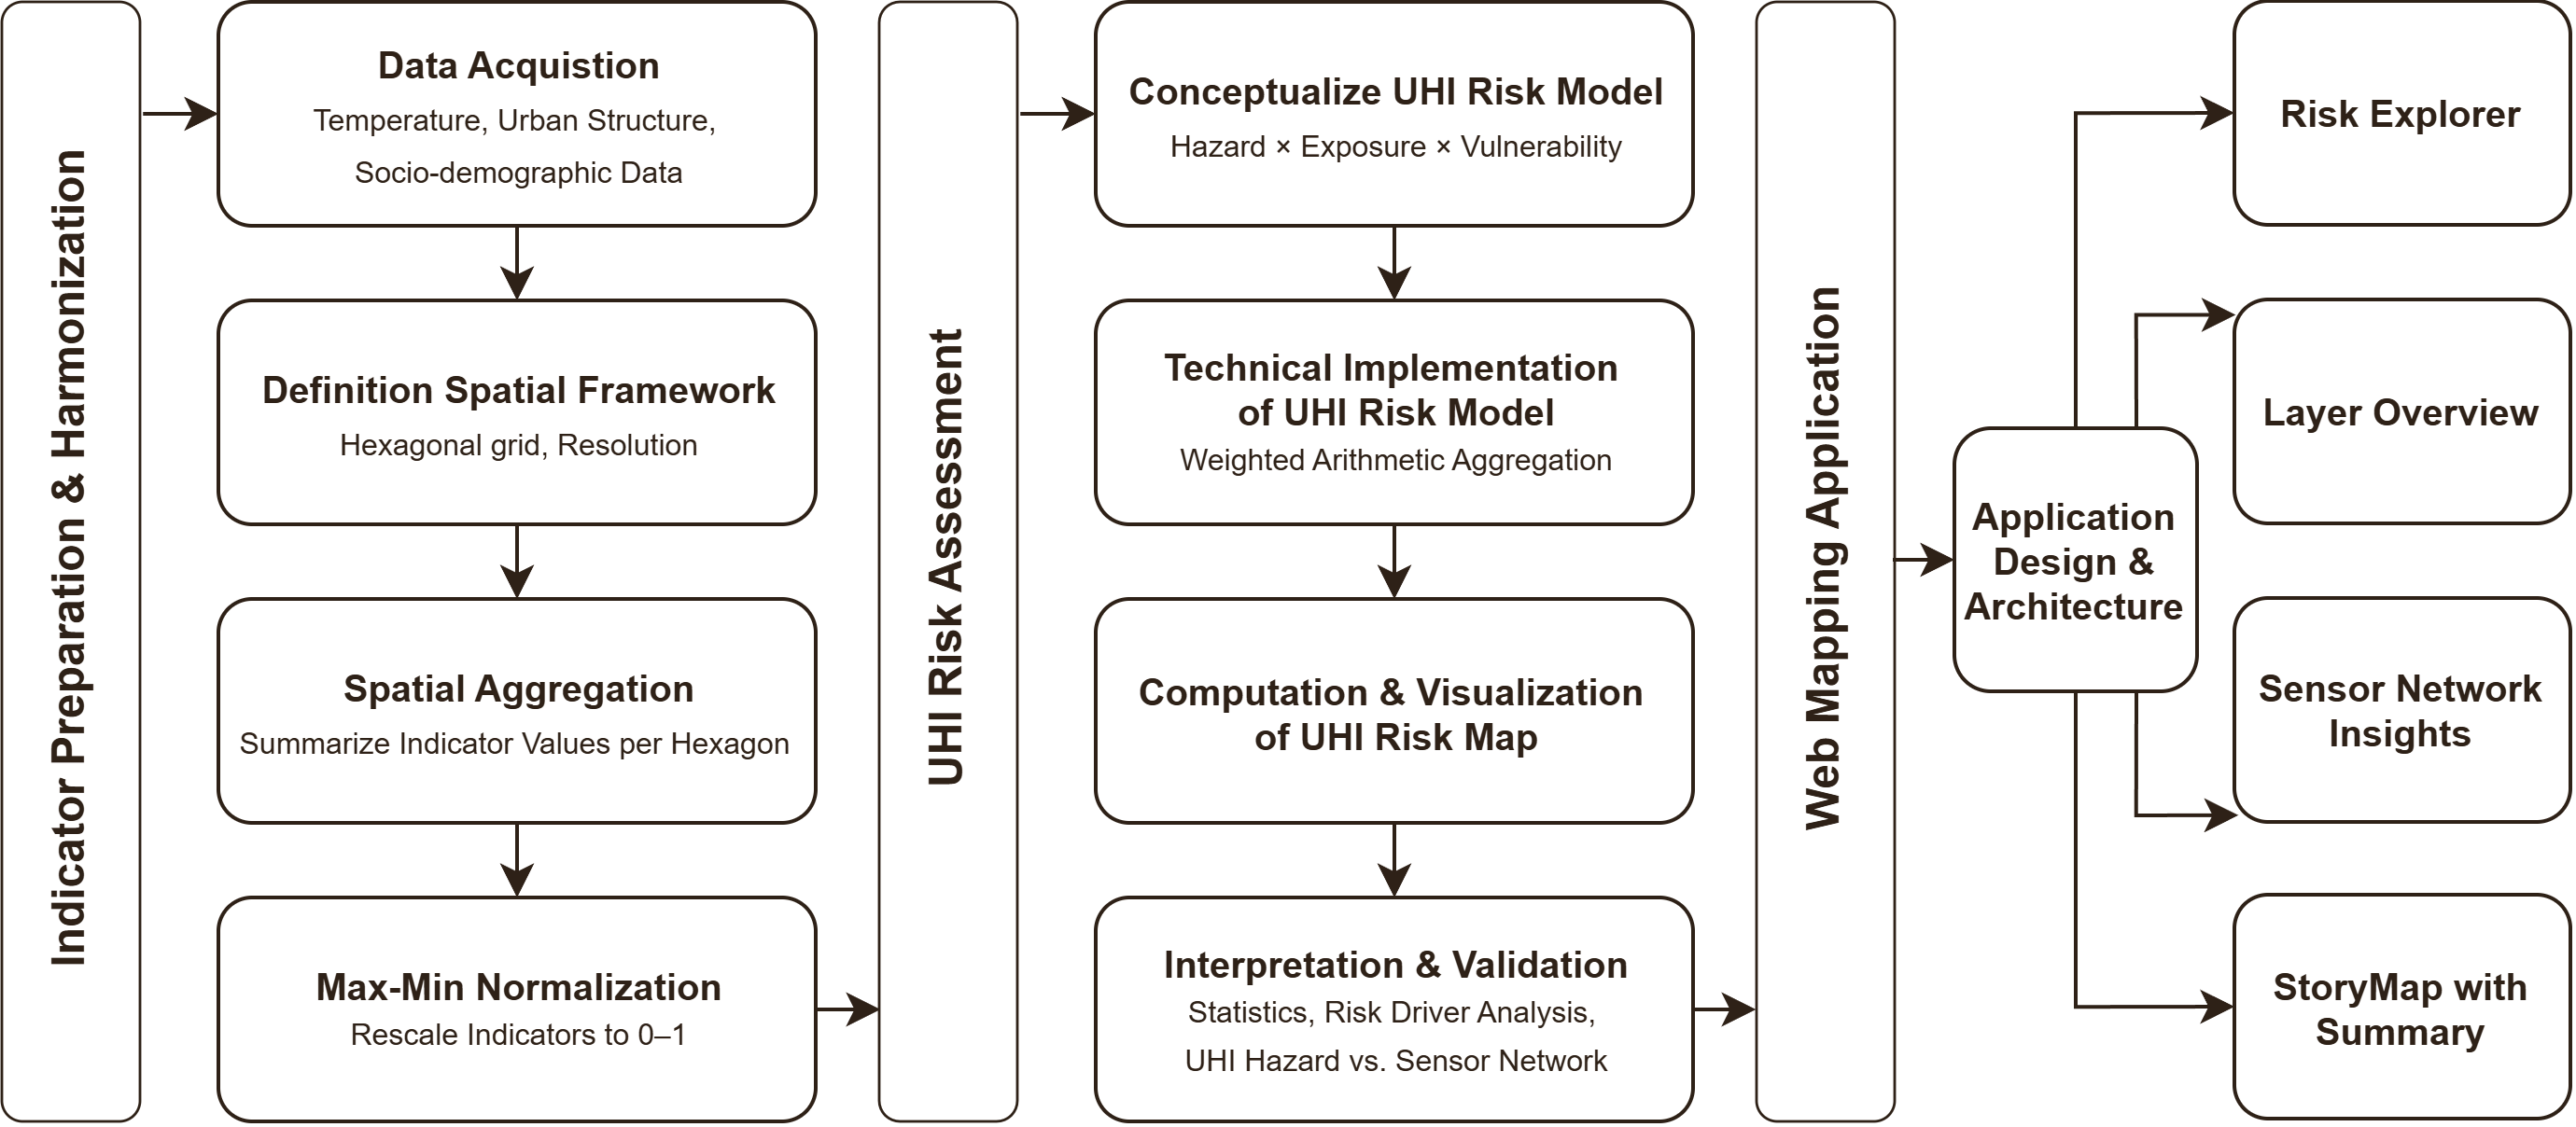
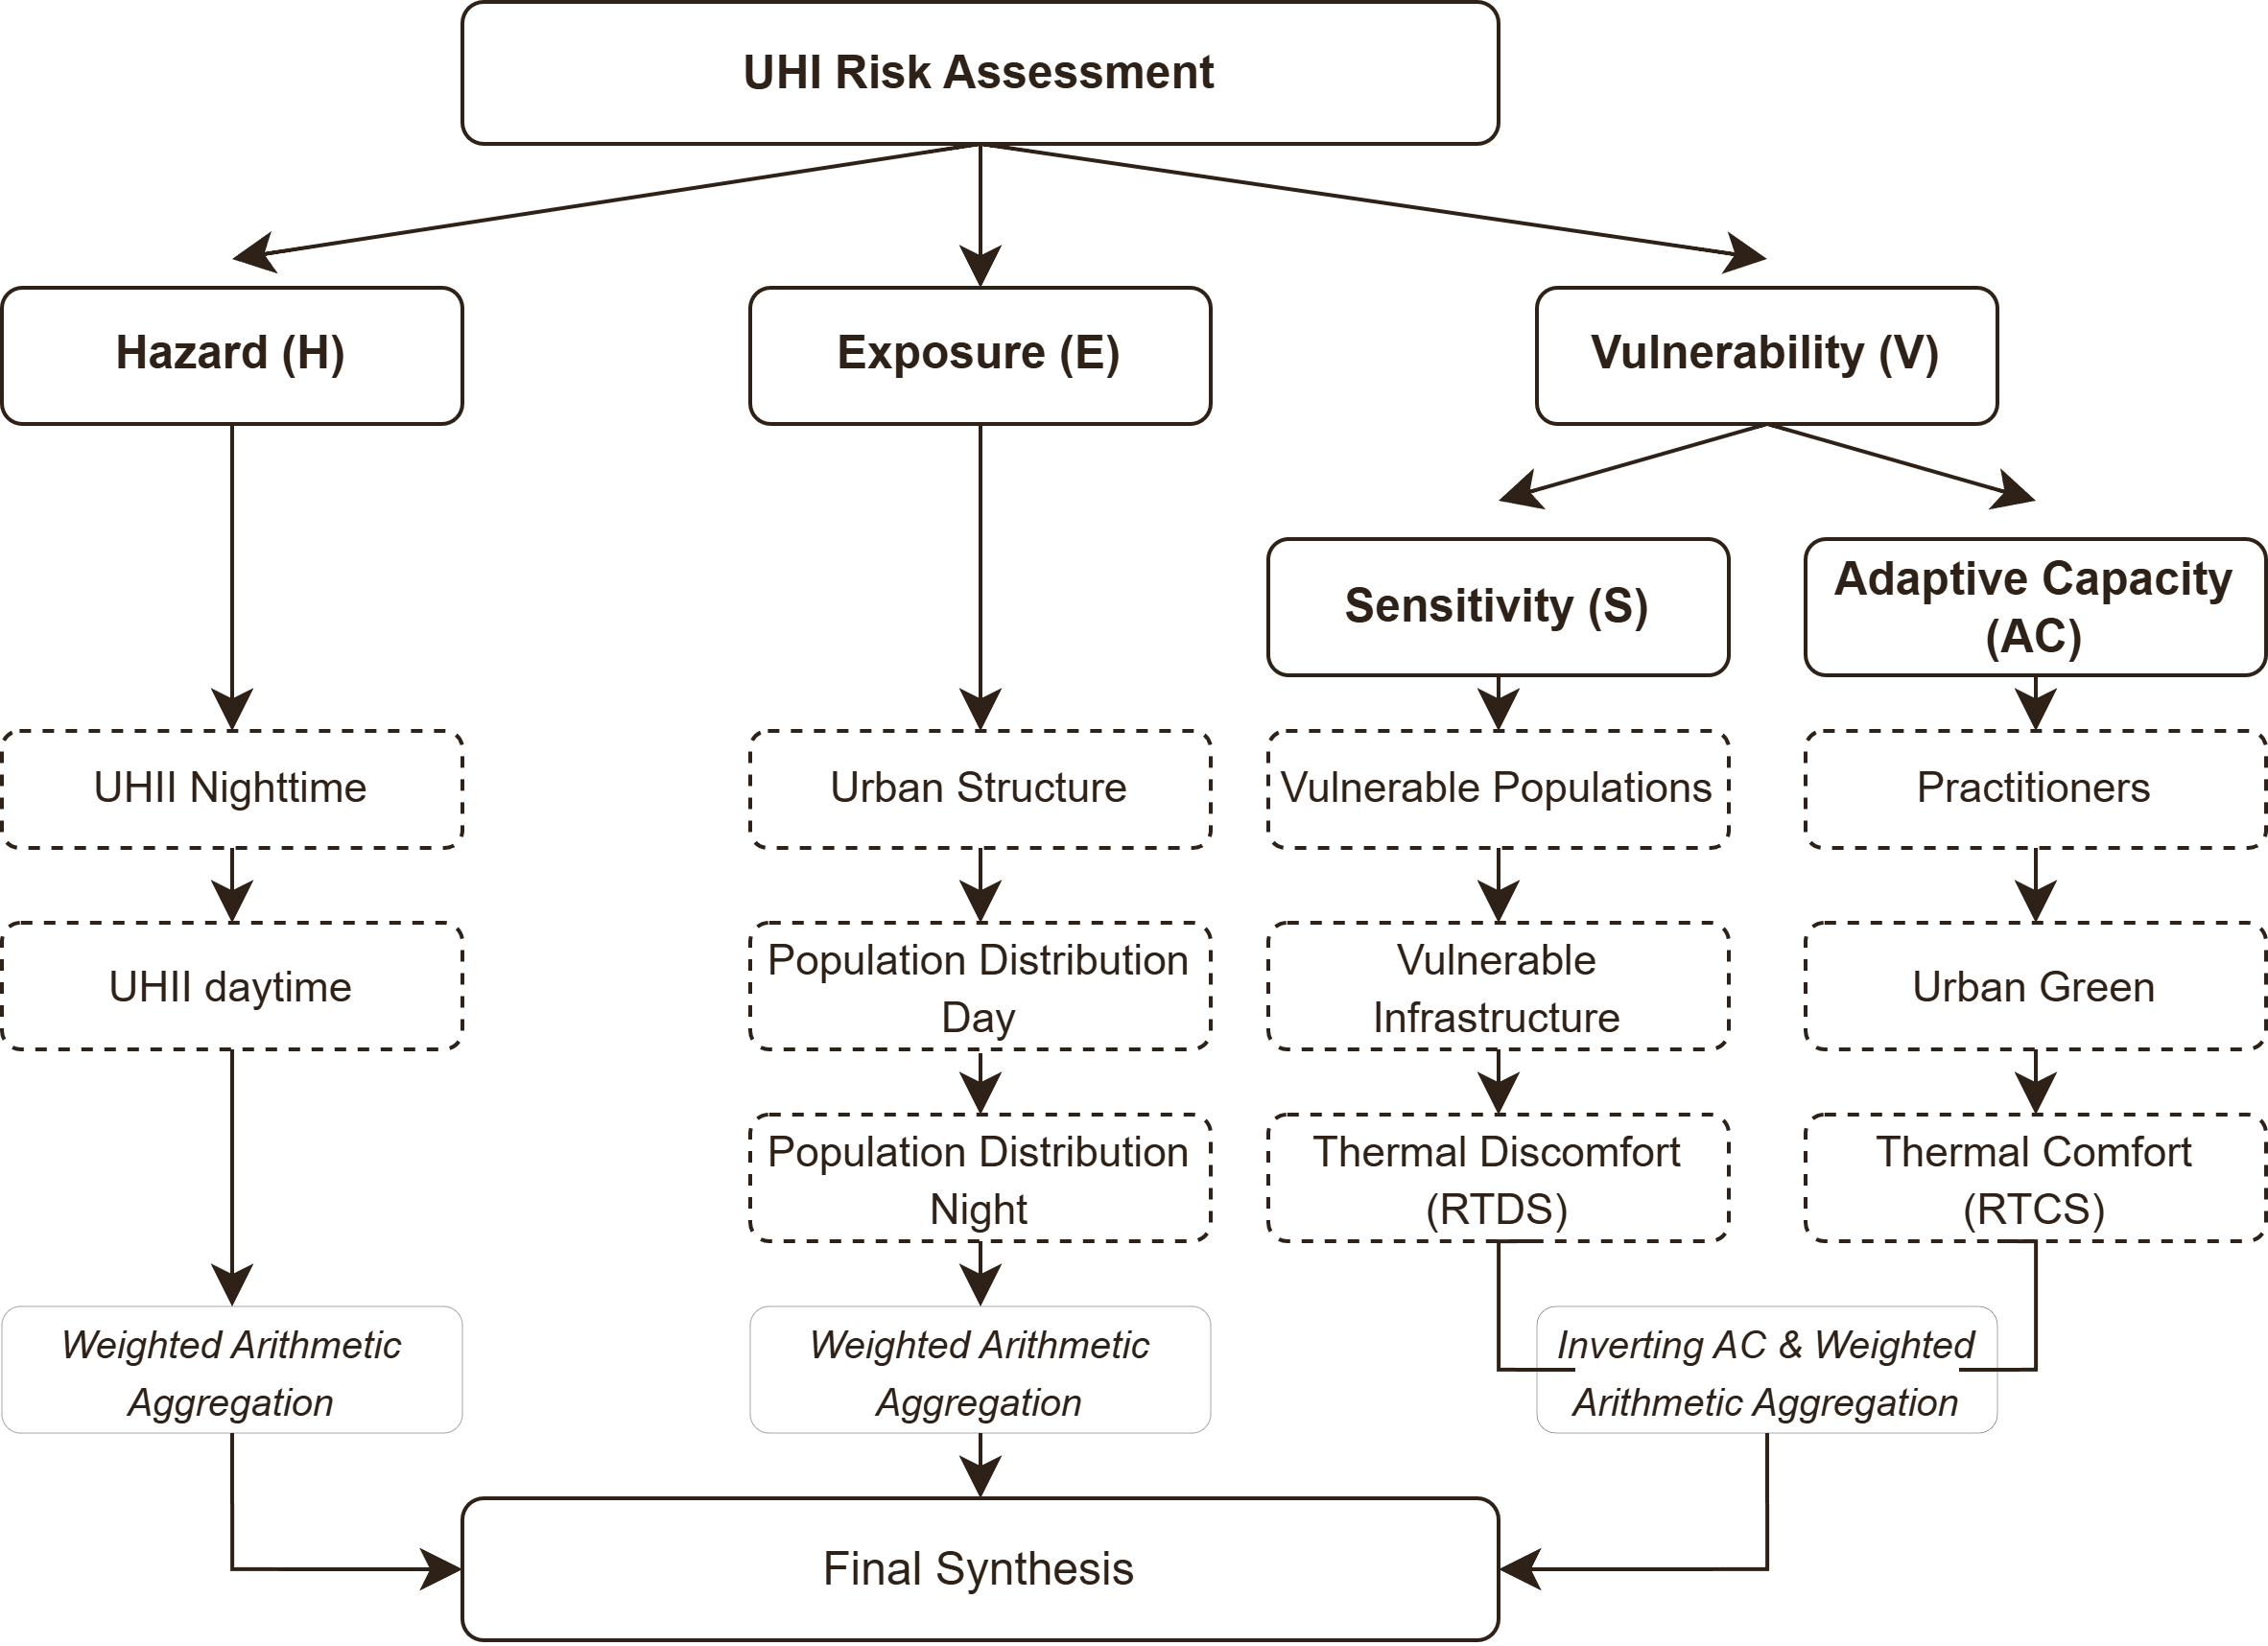
UHI risk was then modeled following the IPCC's climate risk framework as a function of hazard, exposure and vulnerability, with vulnerability further split into sensitivity and adaptive capacity (IPCC, 2014). Hazard was derived from ECOSTRESS land surface temperature; exposure from urban structure and population density; sensitivity from vulnerable population groups, vulnerable infrastructure and reported thermal discomfort; and adaptive capacity from green space, healthcare access and reported thermal comfort. The hazard component was validated against an IoT sensor network of ten weather stations.
The model was implemented as a reproducible ArcGIS Pro toolbox, freely available on GitHub, allowing the methodology to be applied to other cities and datasets.
Results
UHI risk is highest in and around Olomouc's densely built city center, but its drivers differ across the city. Industrial and commercial zones show high risk mainly because of elevated surface temperatures, while residential neighborhoods such as Nové Sady and Povel stand out due to a high concentration of vulnerable residents rather than heat alone. Public parks consistently reduce risk by lowering hazard and improving thermal comfort.
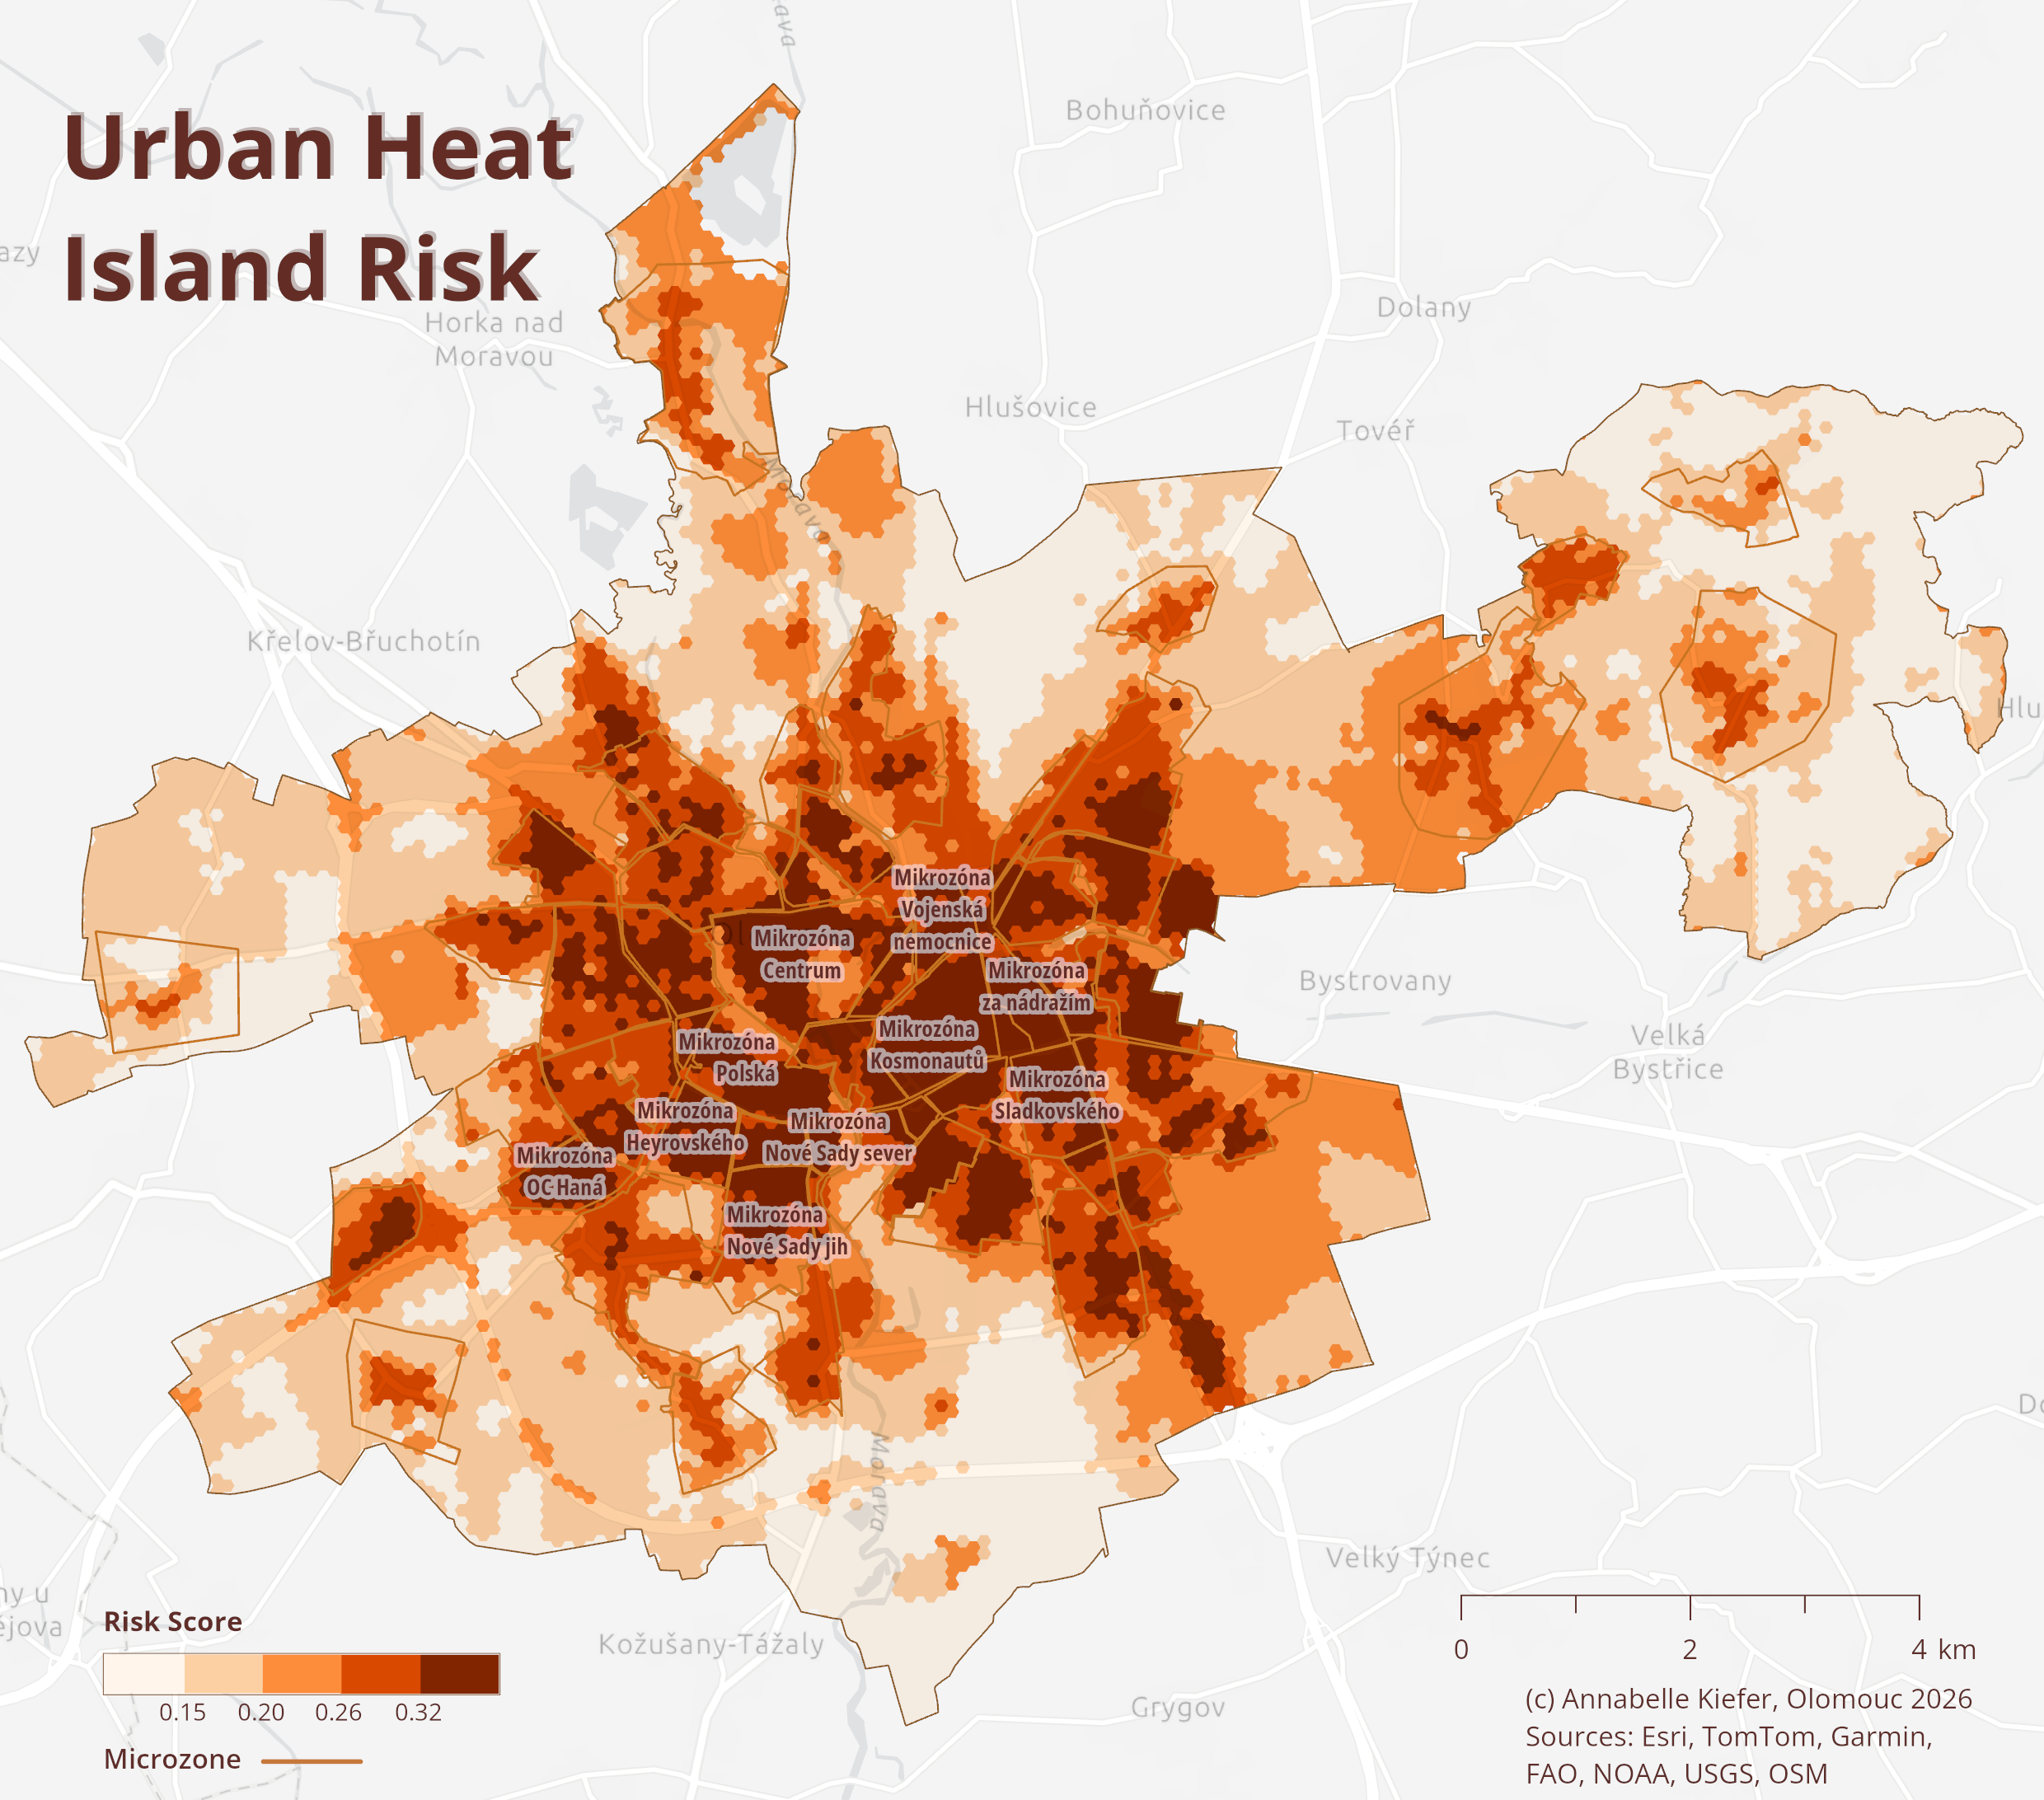
For further insights, all indicator and component maps can be found in the map gallery.
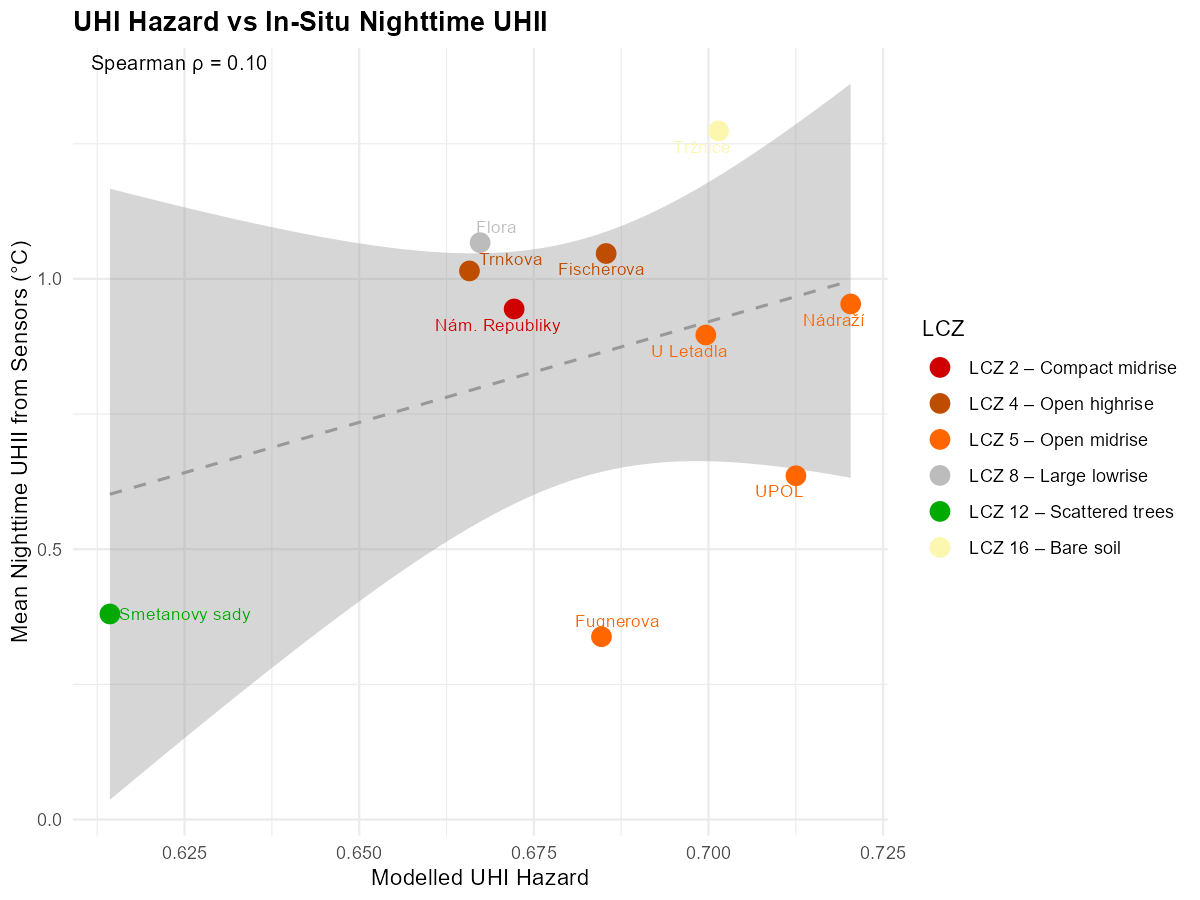
Comparing the model's hazard component to sensor measurements showed only weak agreement, suggesting that satellite-derived surface temperature alone does not fully capture nighttime air temperature patterns, a gap that could be closed with the integration of this data as the sensor network expands.
Conclusion
This thesis shows that combining objective thermal data with subjective thermal perception and socio-demographic vulnerability gives a more complete picture of UHI risk than physical measurements alone. Comparing the results to Olomouc's existing adaptation strategy confirmed that the city's current approach only partly considers residential areas with high concentrations of vulnerable people, which this framework was able to identify.
These differentiated priority zones translate into different recommendations ranging from shading and cooling measures for the pedestrian-heavy city center, early warning systems for vulnerable residential neighborhoods and heat-load reduction in industrial areas. Because the underlying model is reproducible, it could be transferred to other cities facing similar challenges.
Some limitations point toward future work: the sensor network was too small to be integrated directly into the risk model and served only for validation and the current hexagon resolution could be refined further with the integration of additional high-resolution data. As Olomouc's IoT sensor network expands and climate projections become available, this framework could be extended to model future UHI risk rather than only present conditions.