Urban Heat Islands in Olomouc: A Geospatial Identification of Thermal Patterns, Urban Structure, and Human Perception.
Click any image to open it at full size.
Indicators
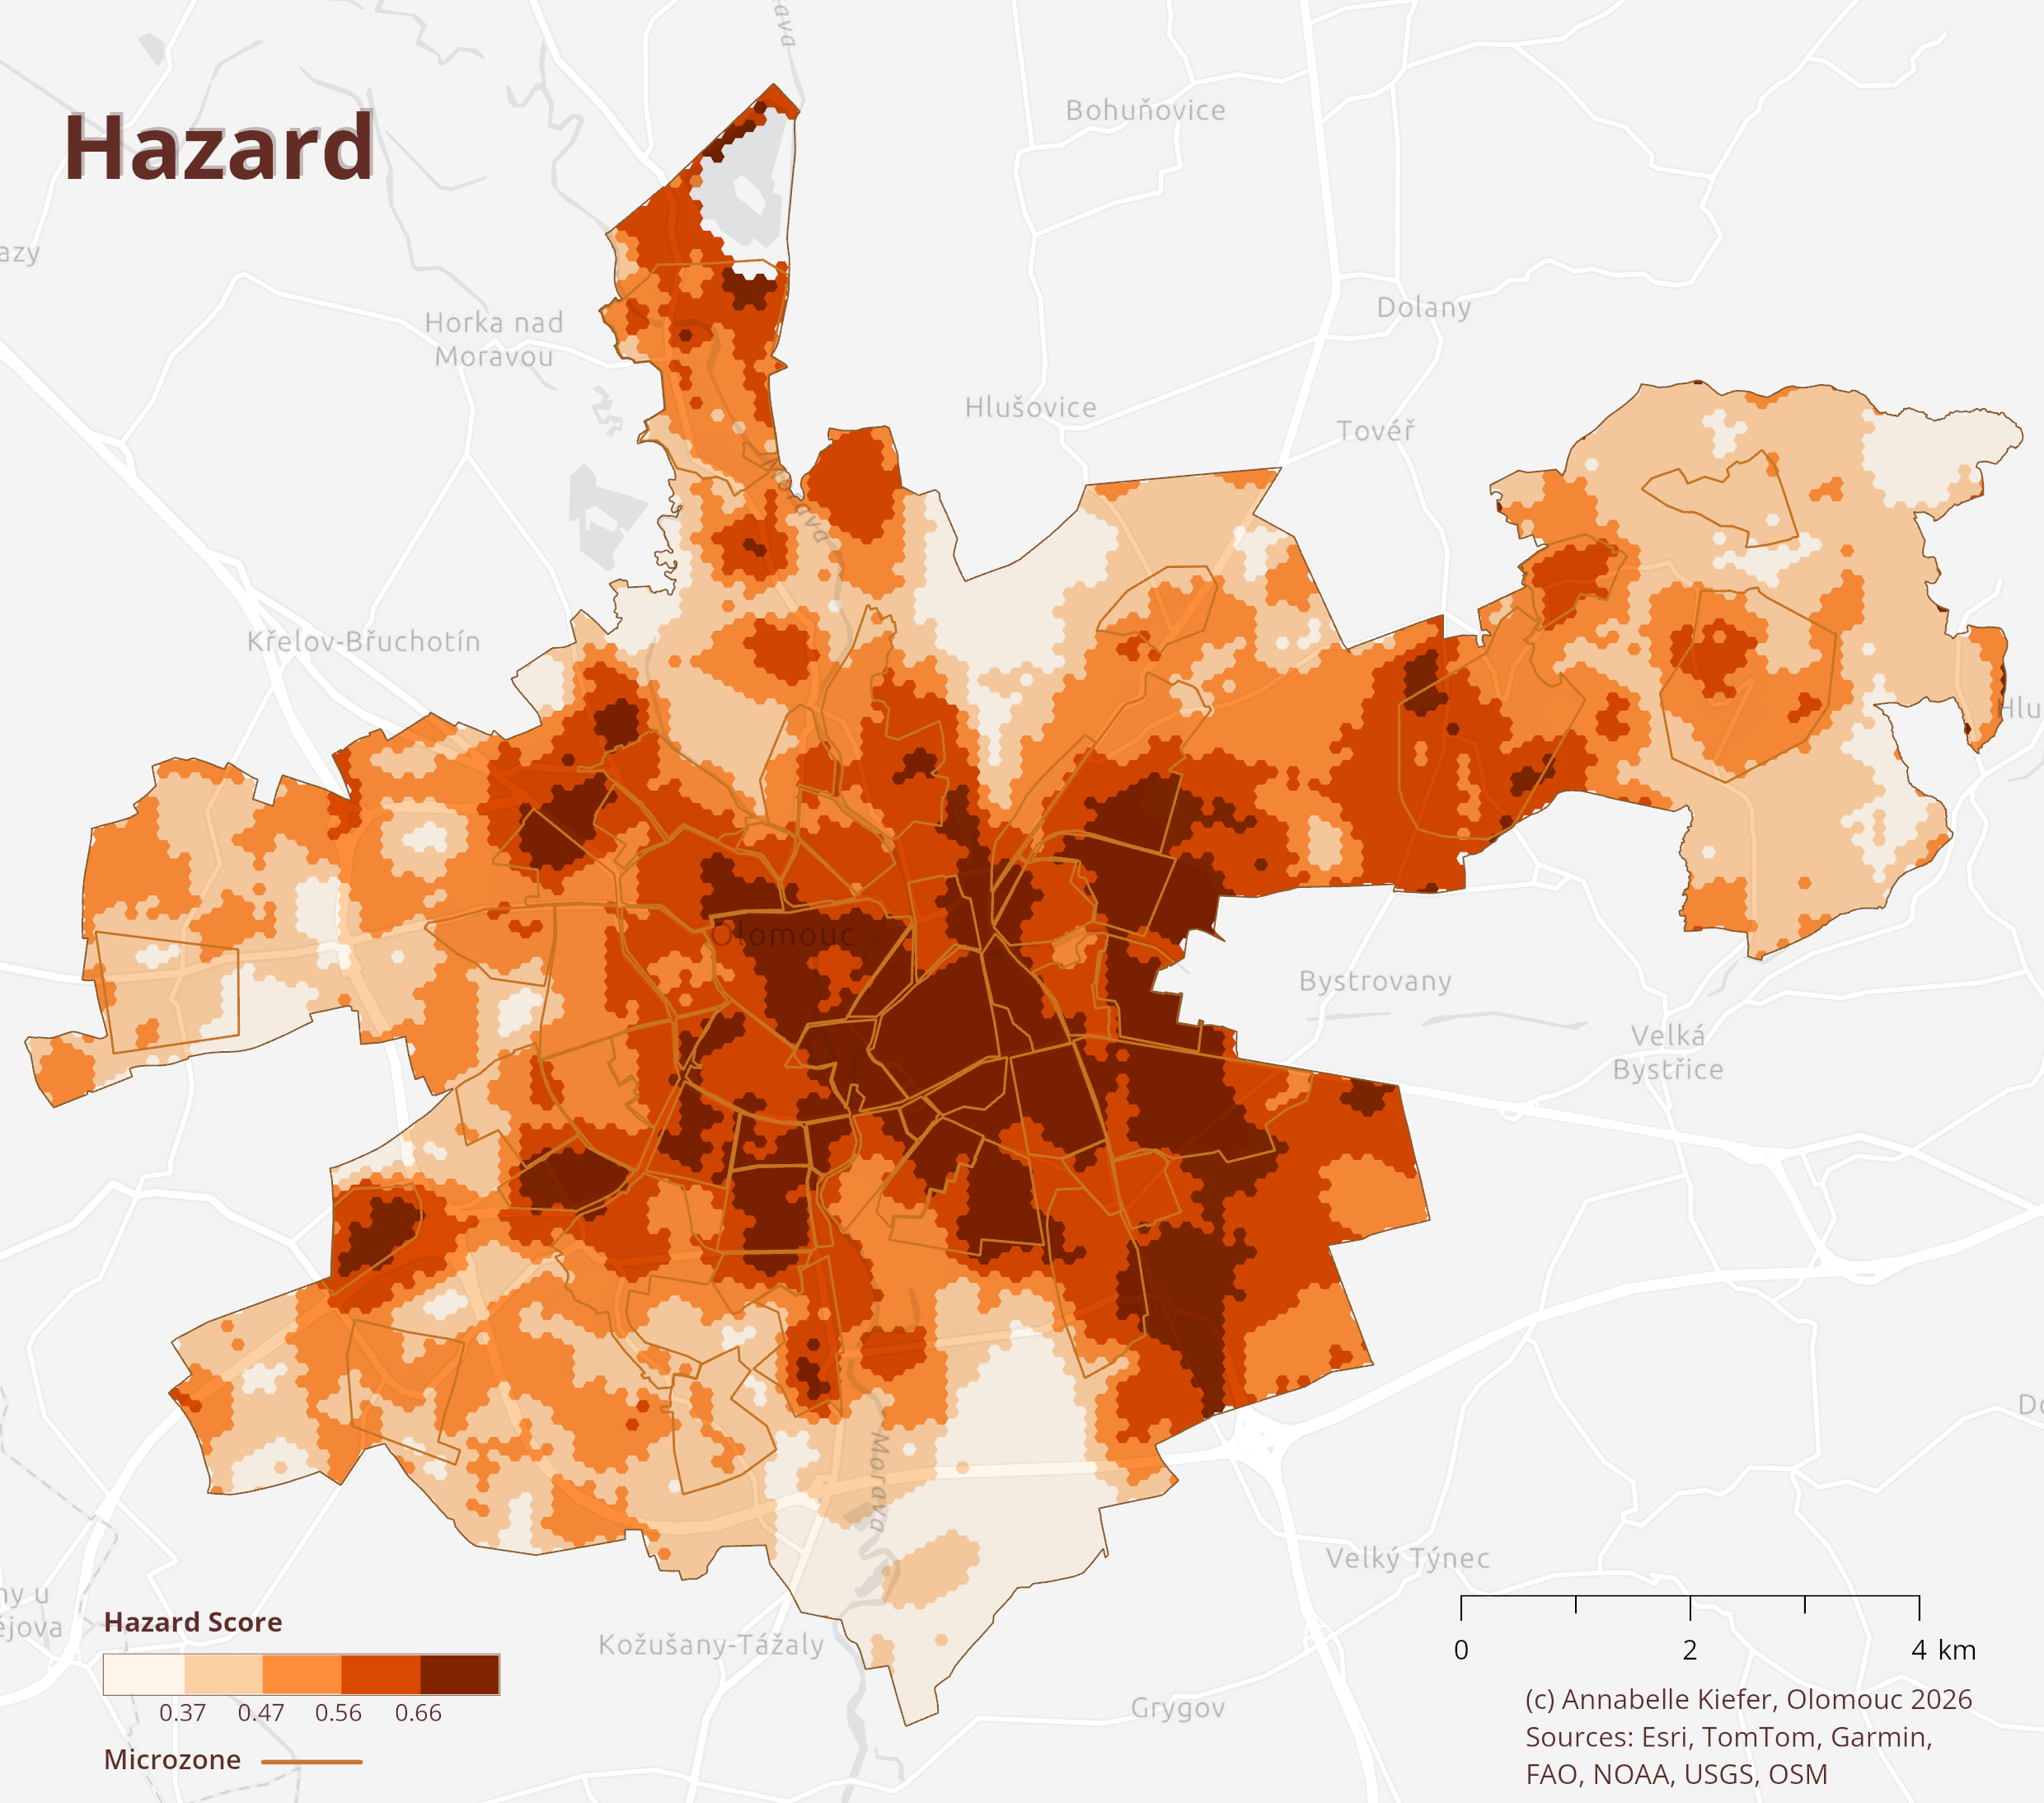
Hazard
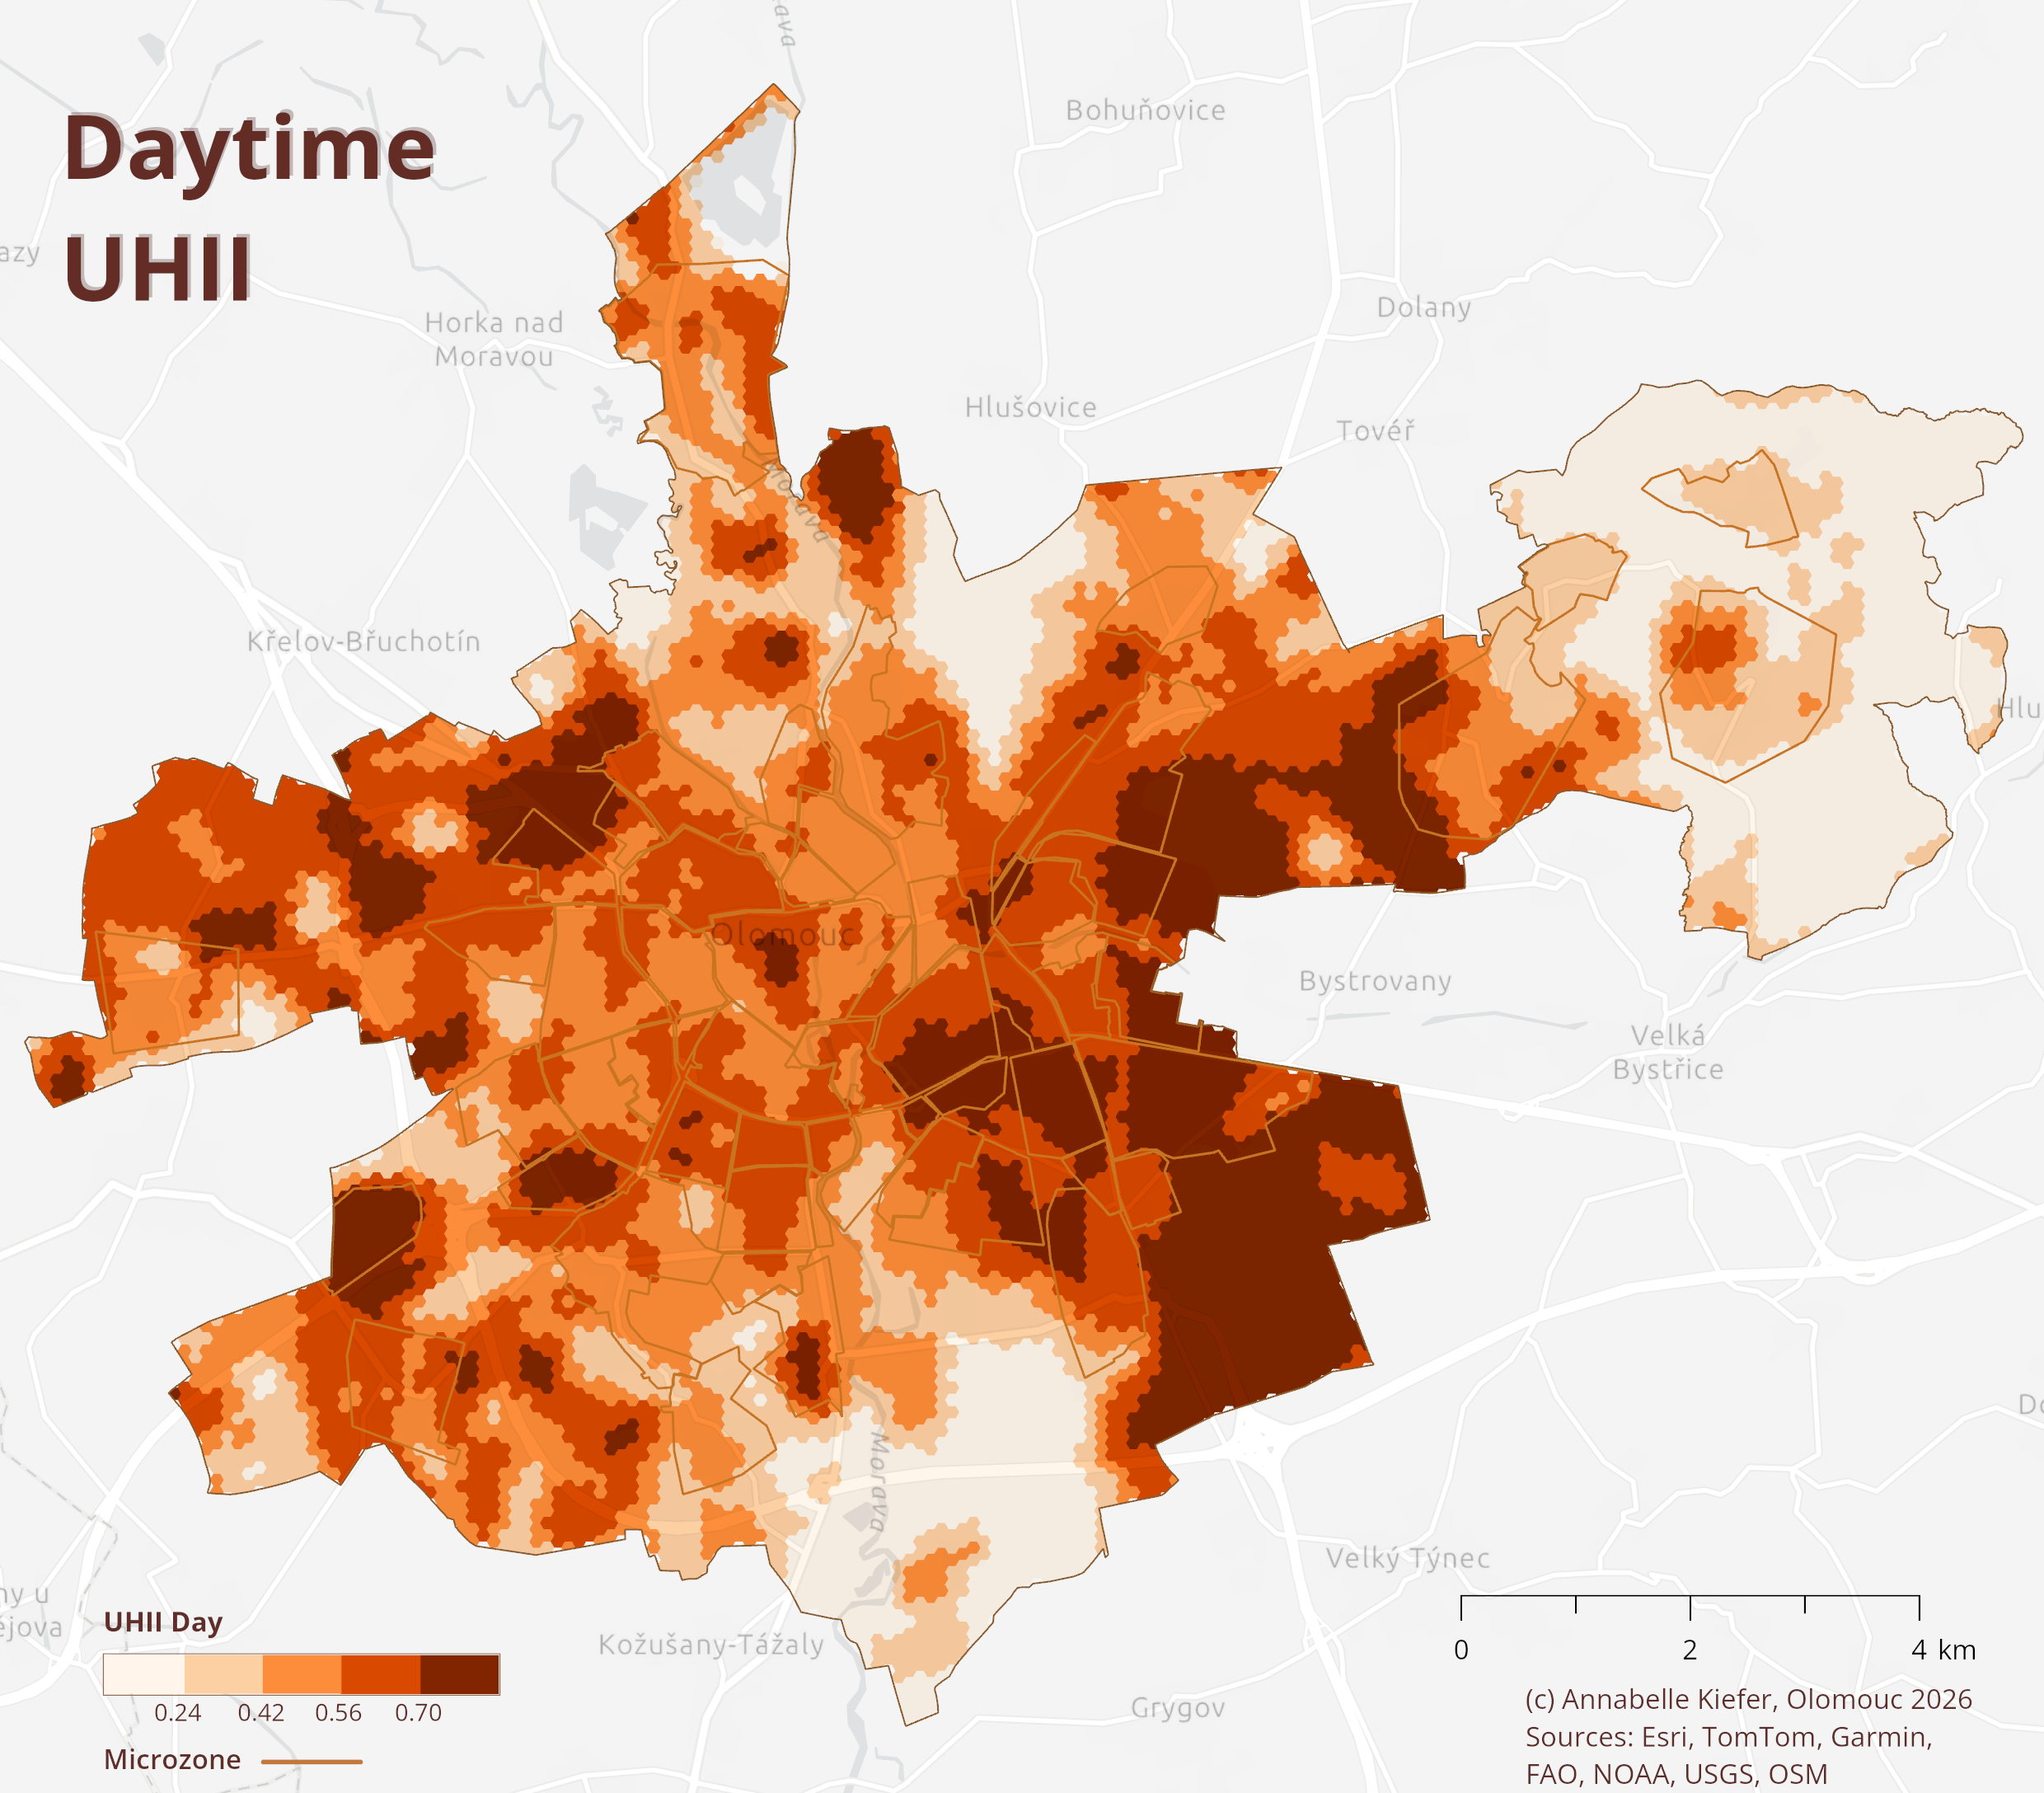
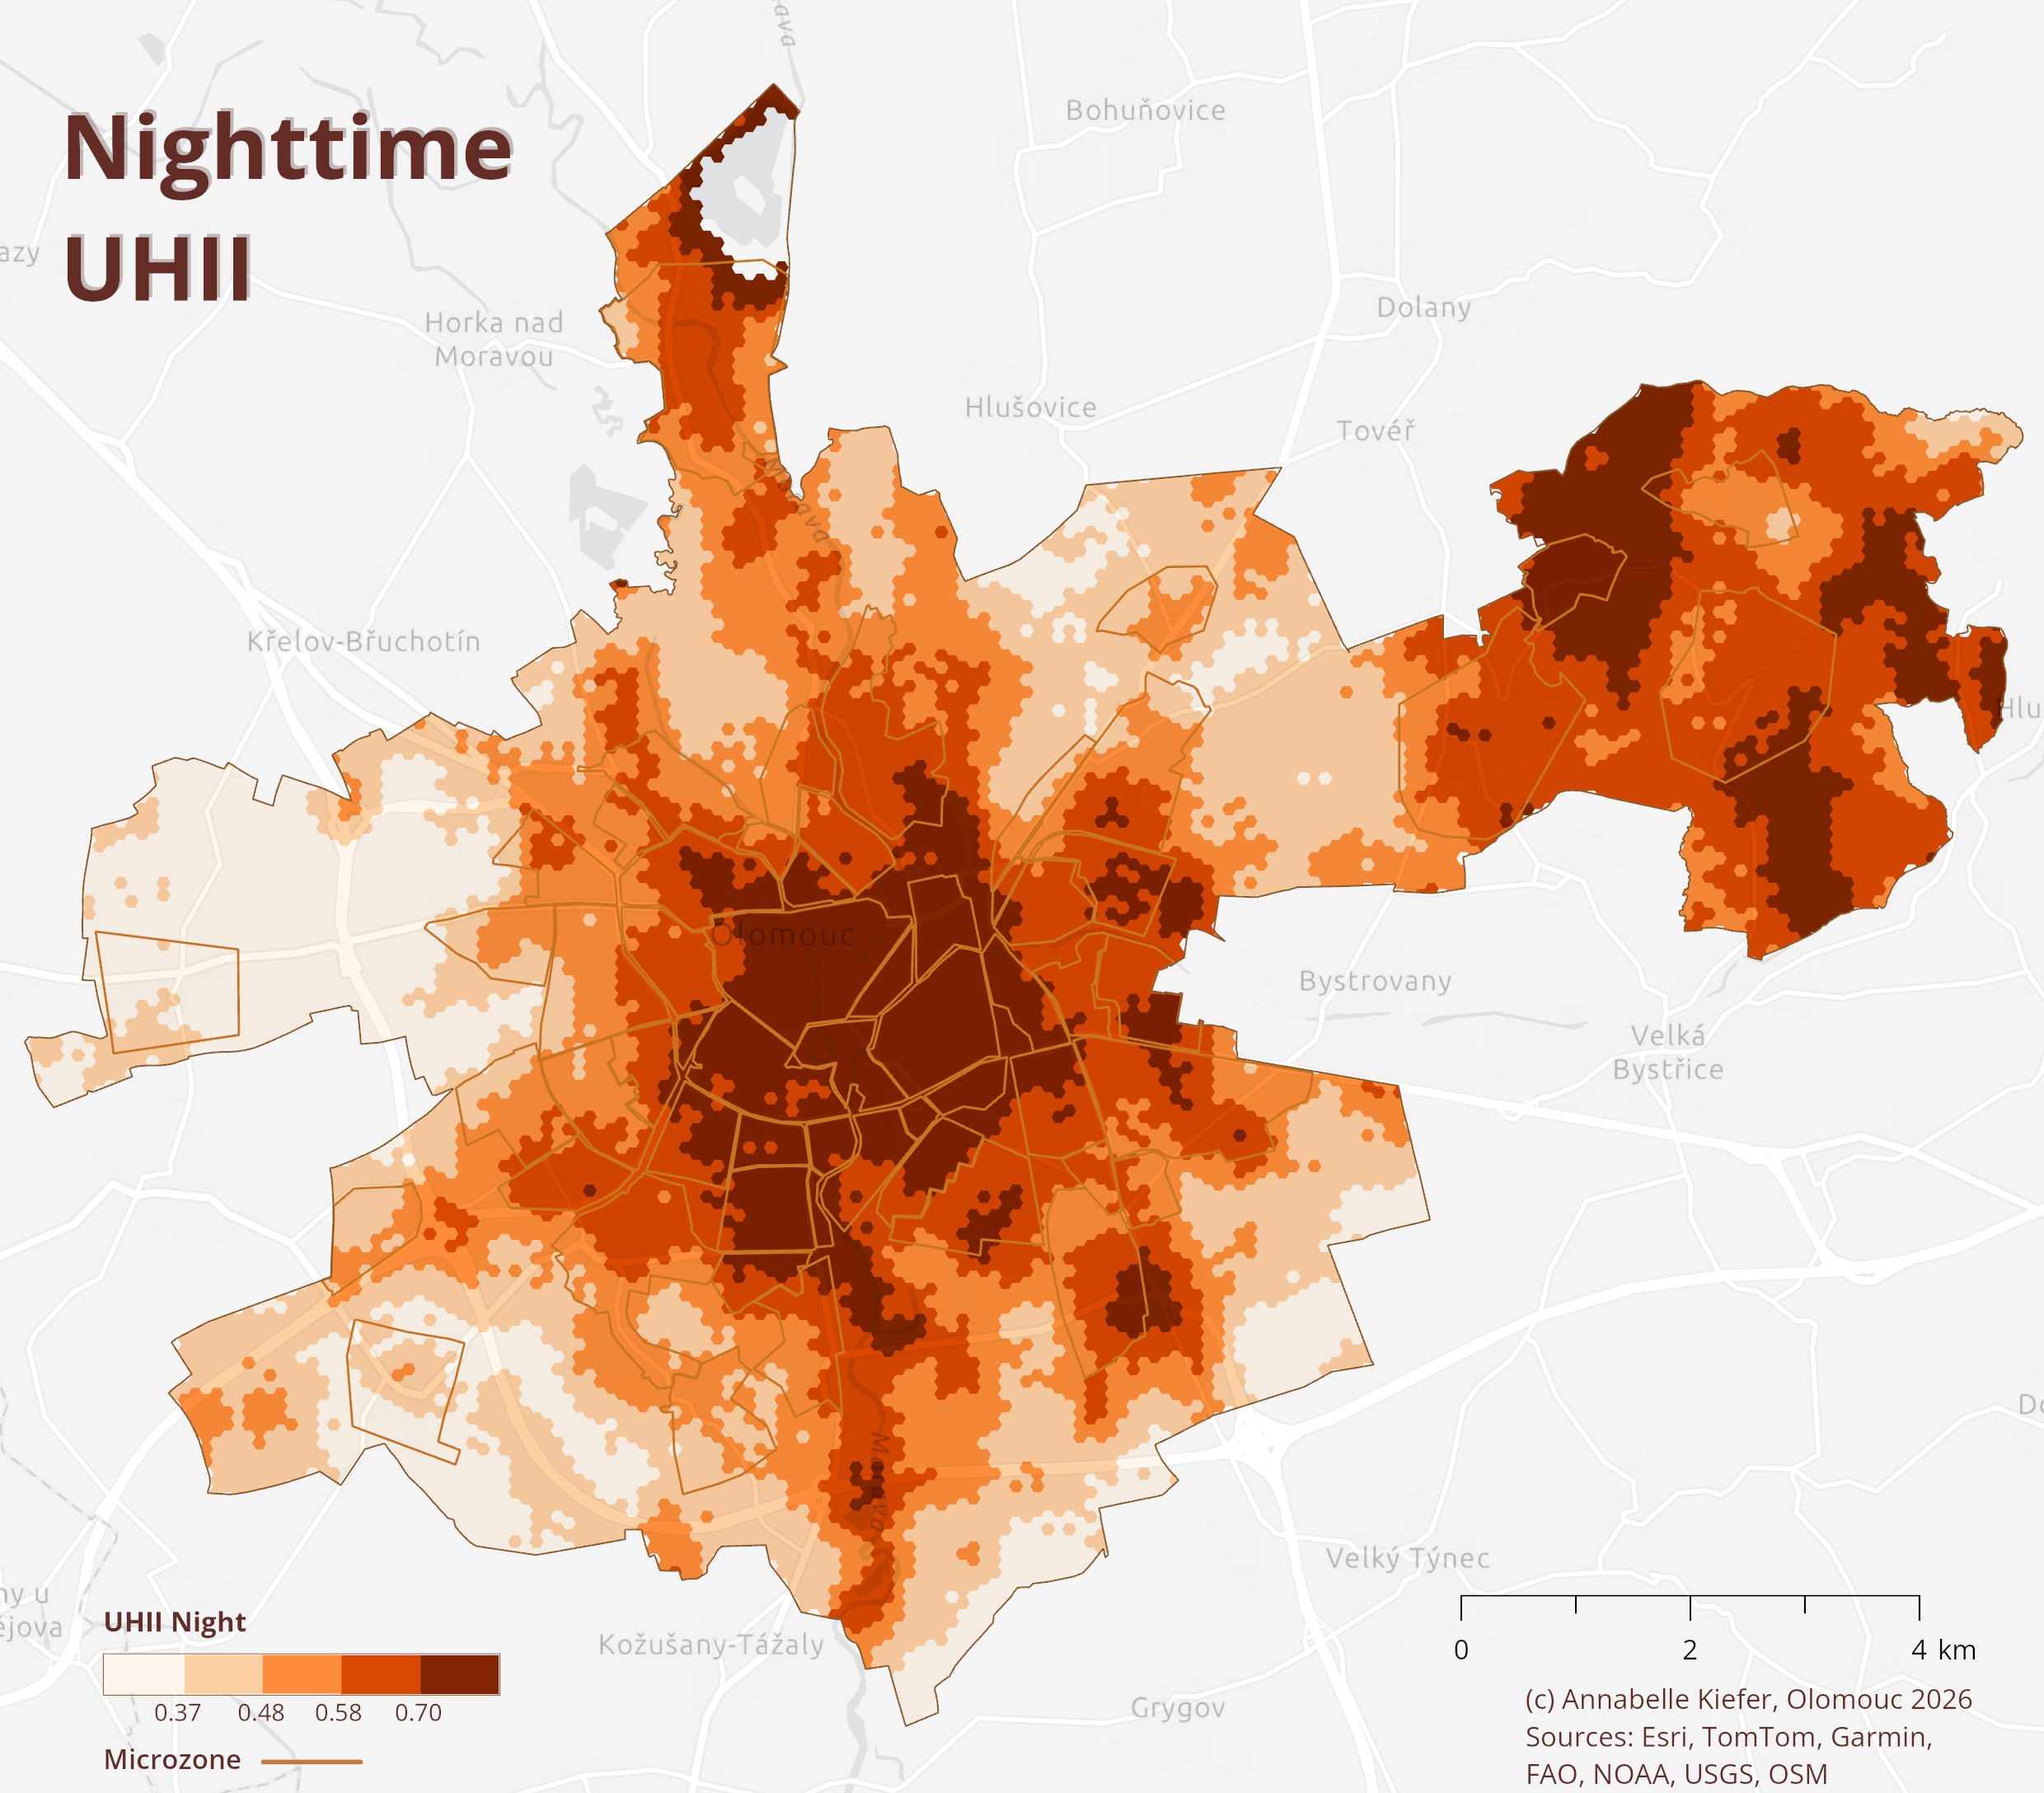
Figure 1 Urban Heat Island Intensity during the Day.Figure 2 Urban Heat Island Intensity during the Night.
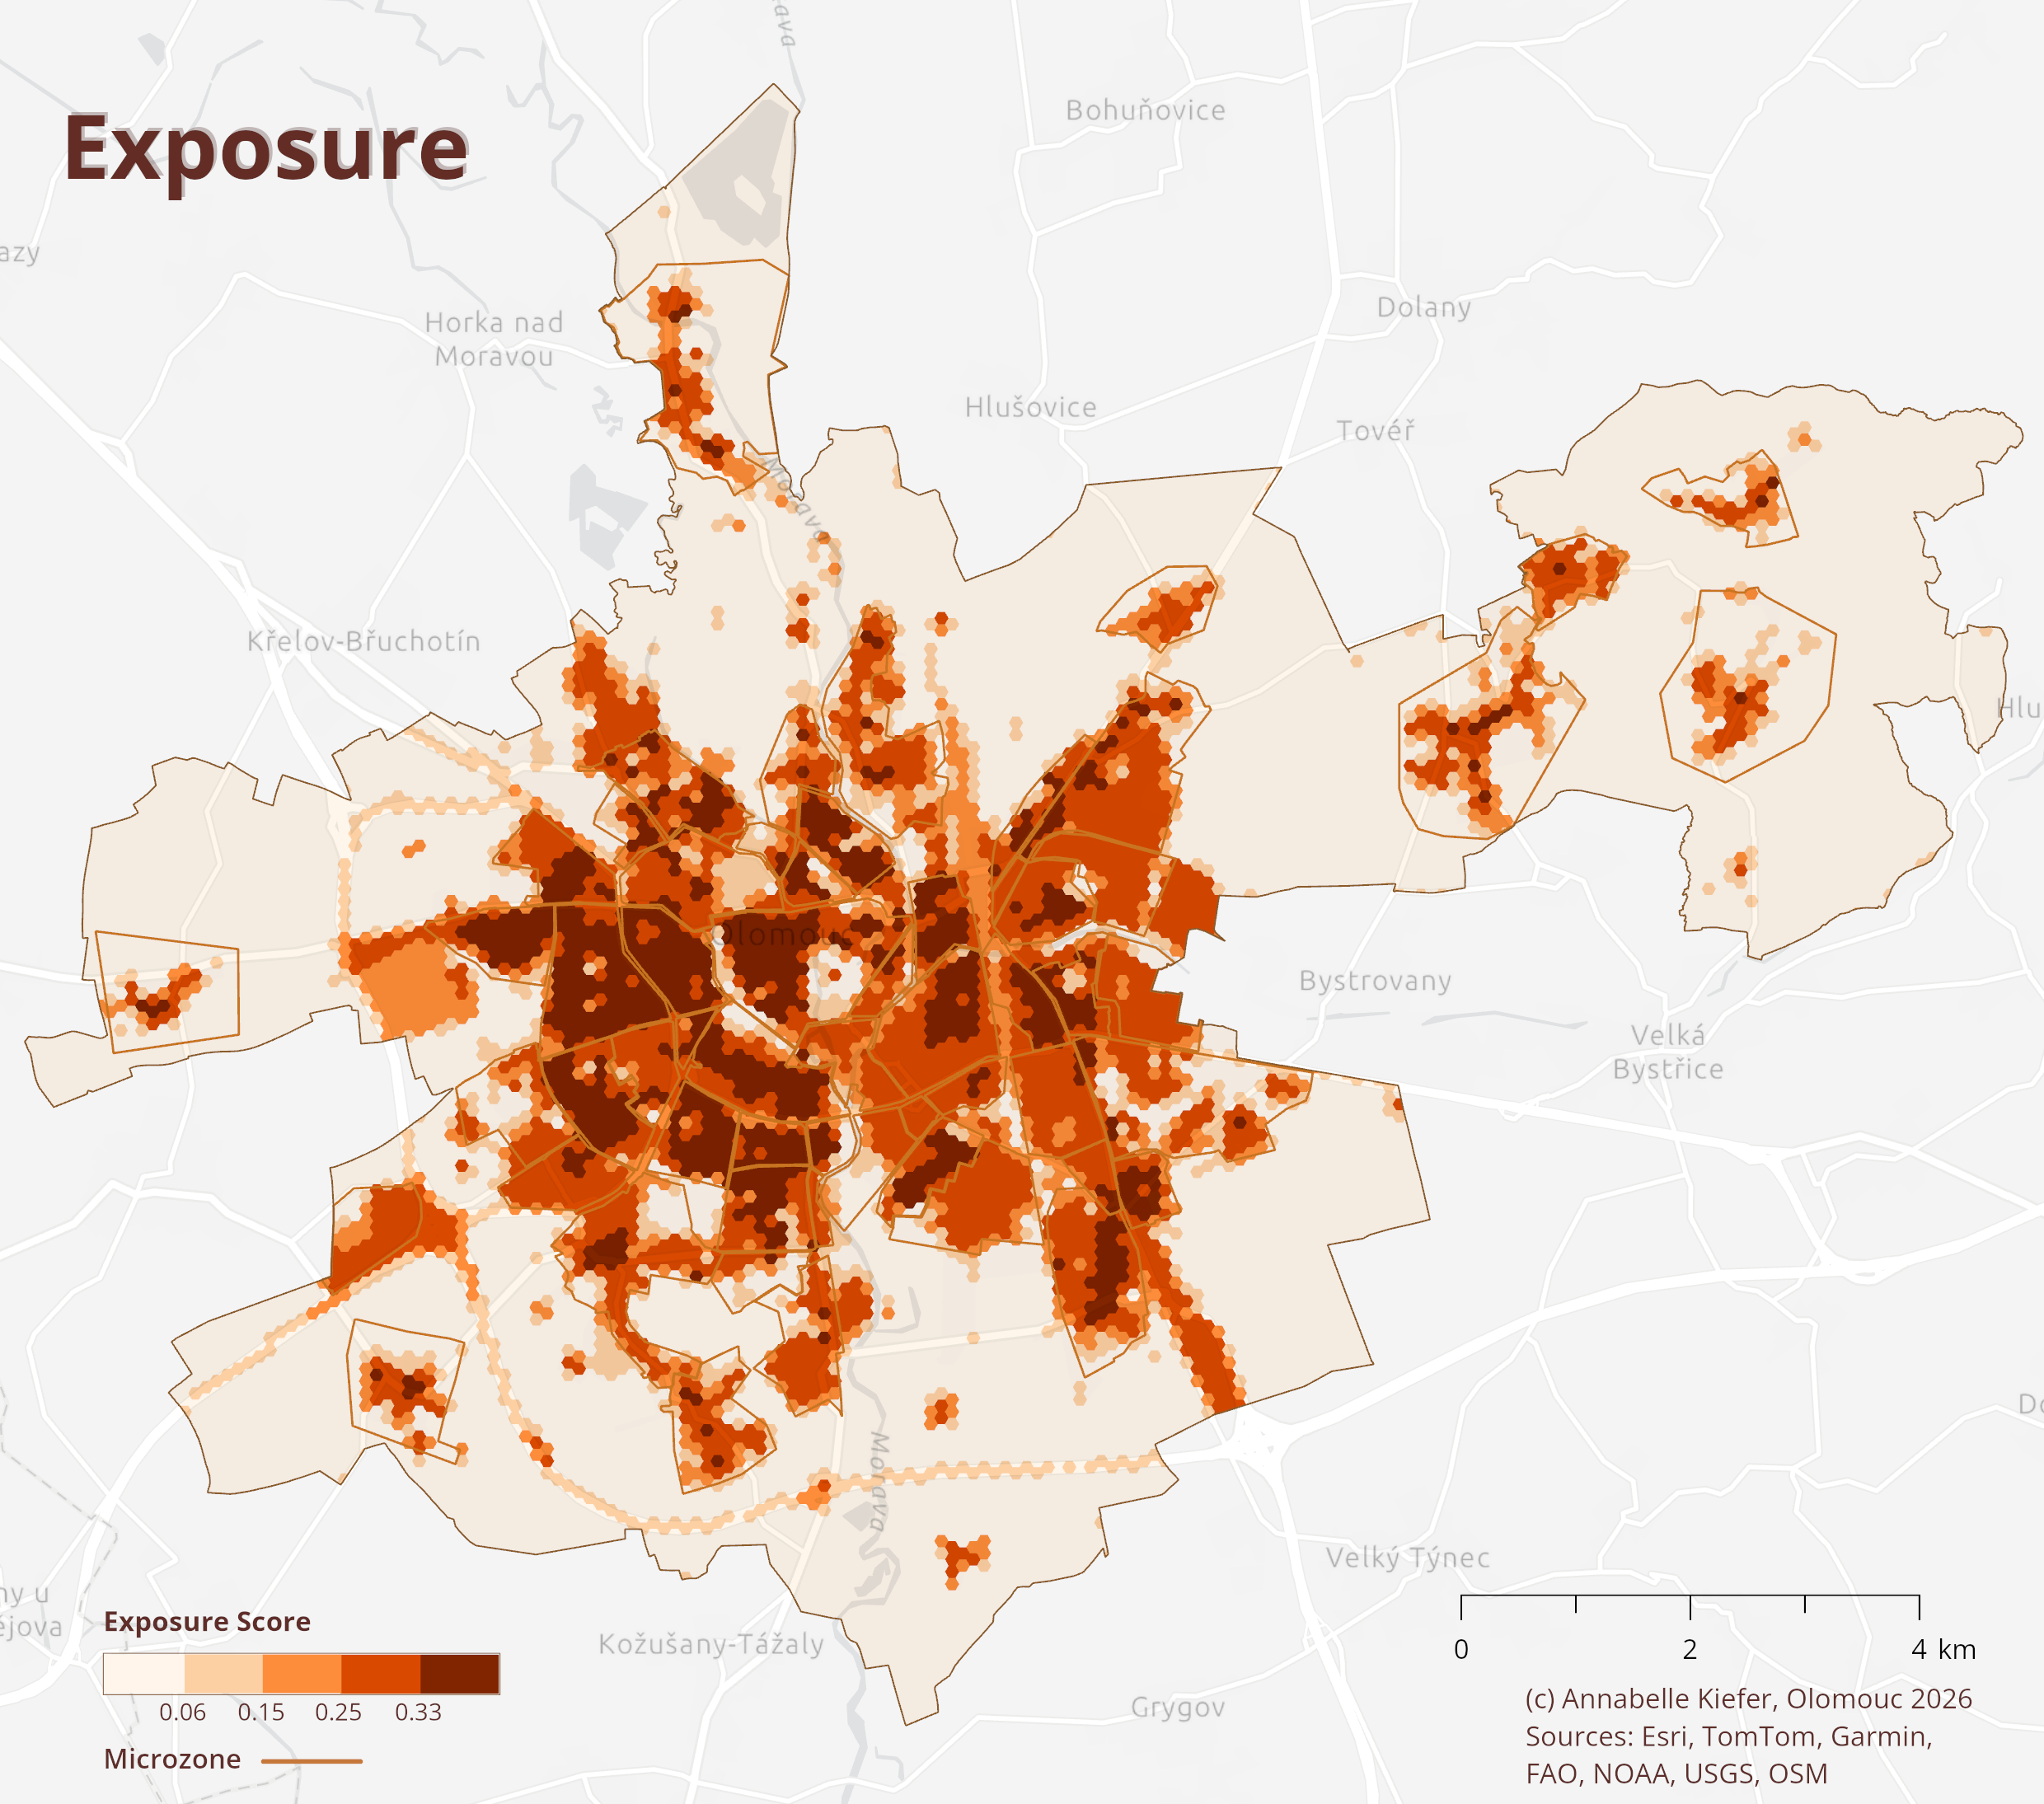
Exposure
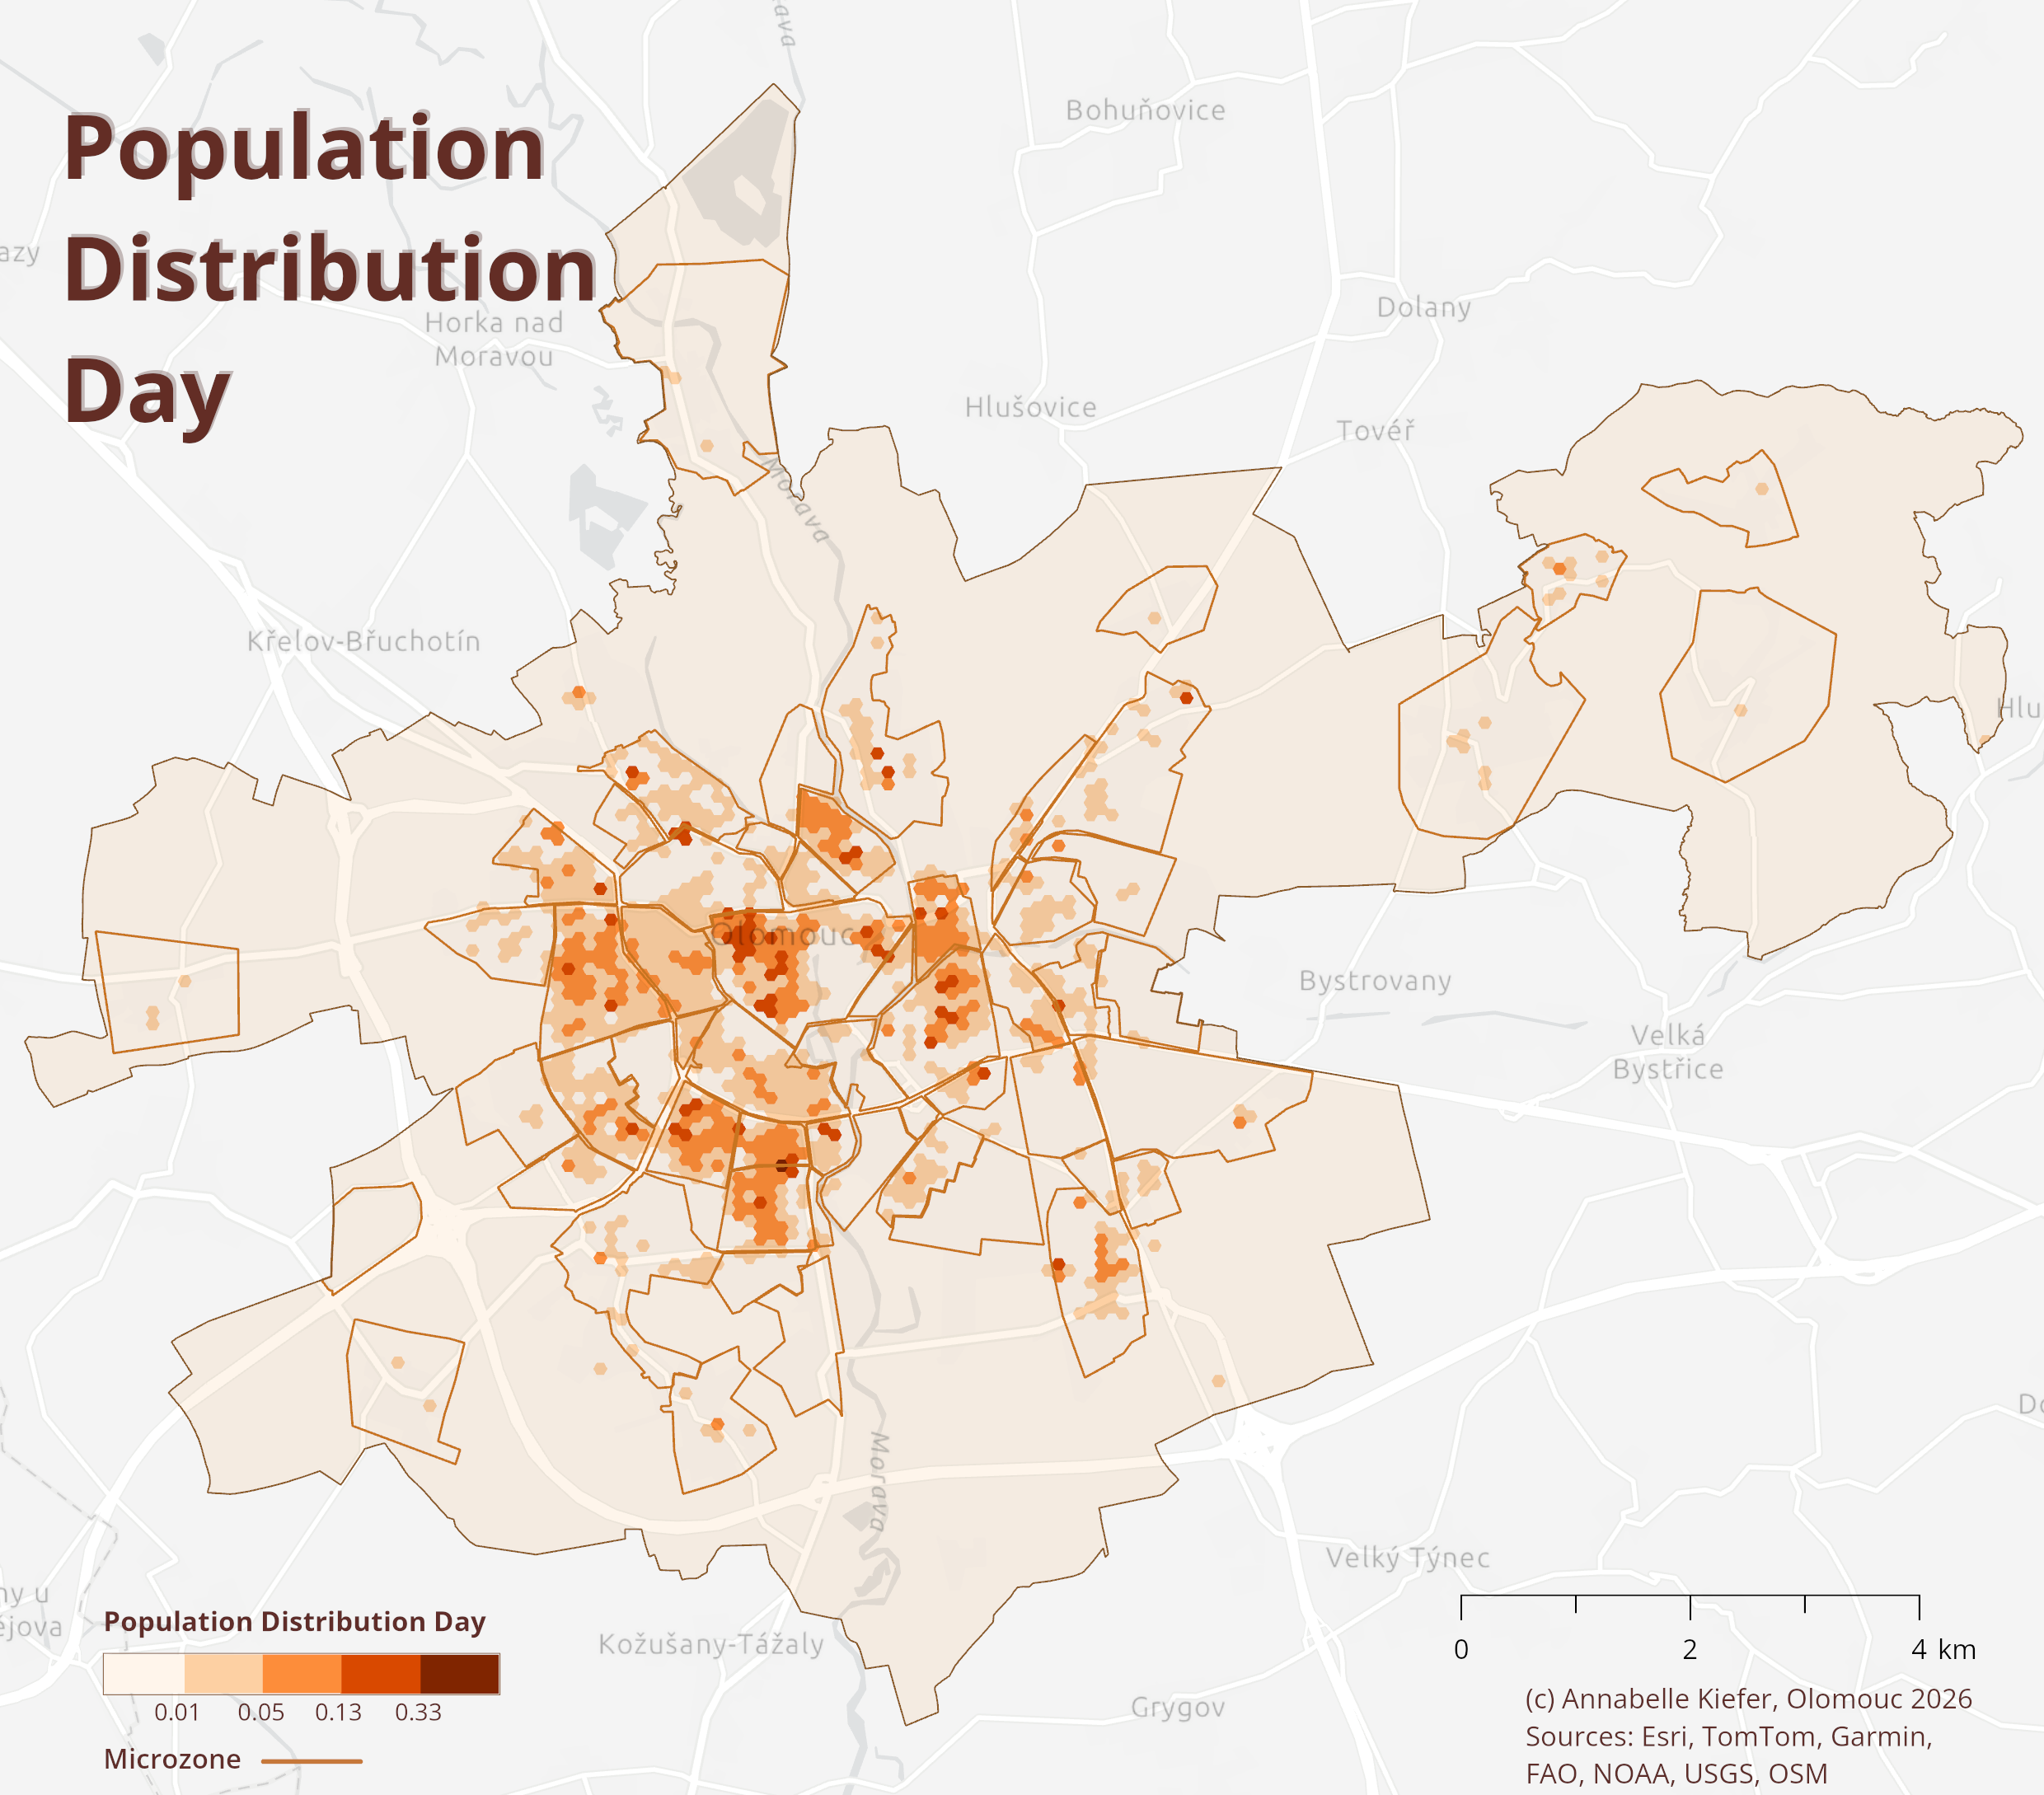
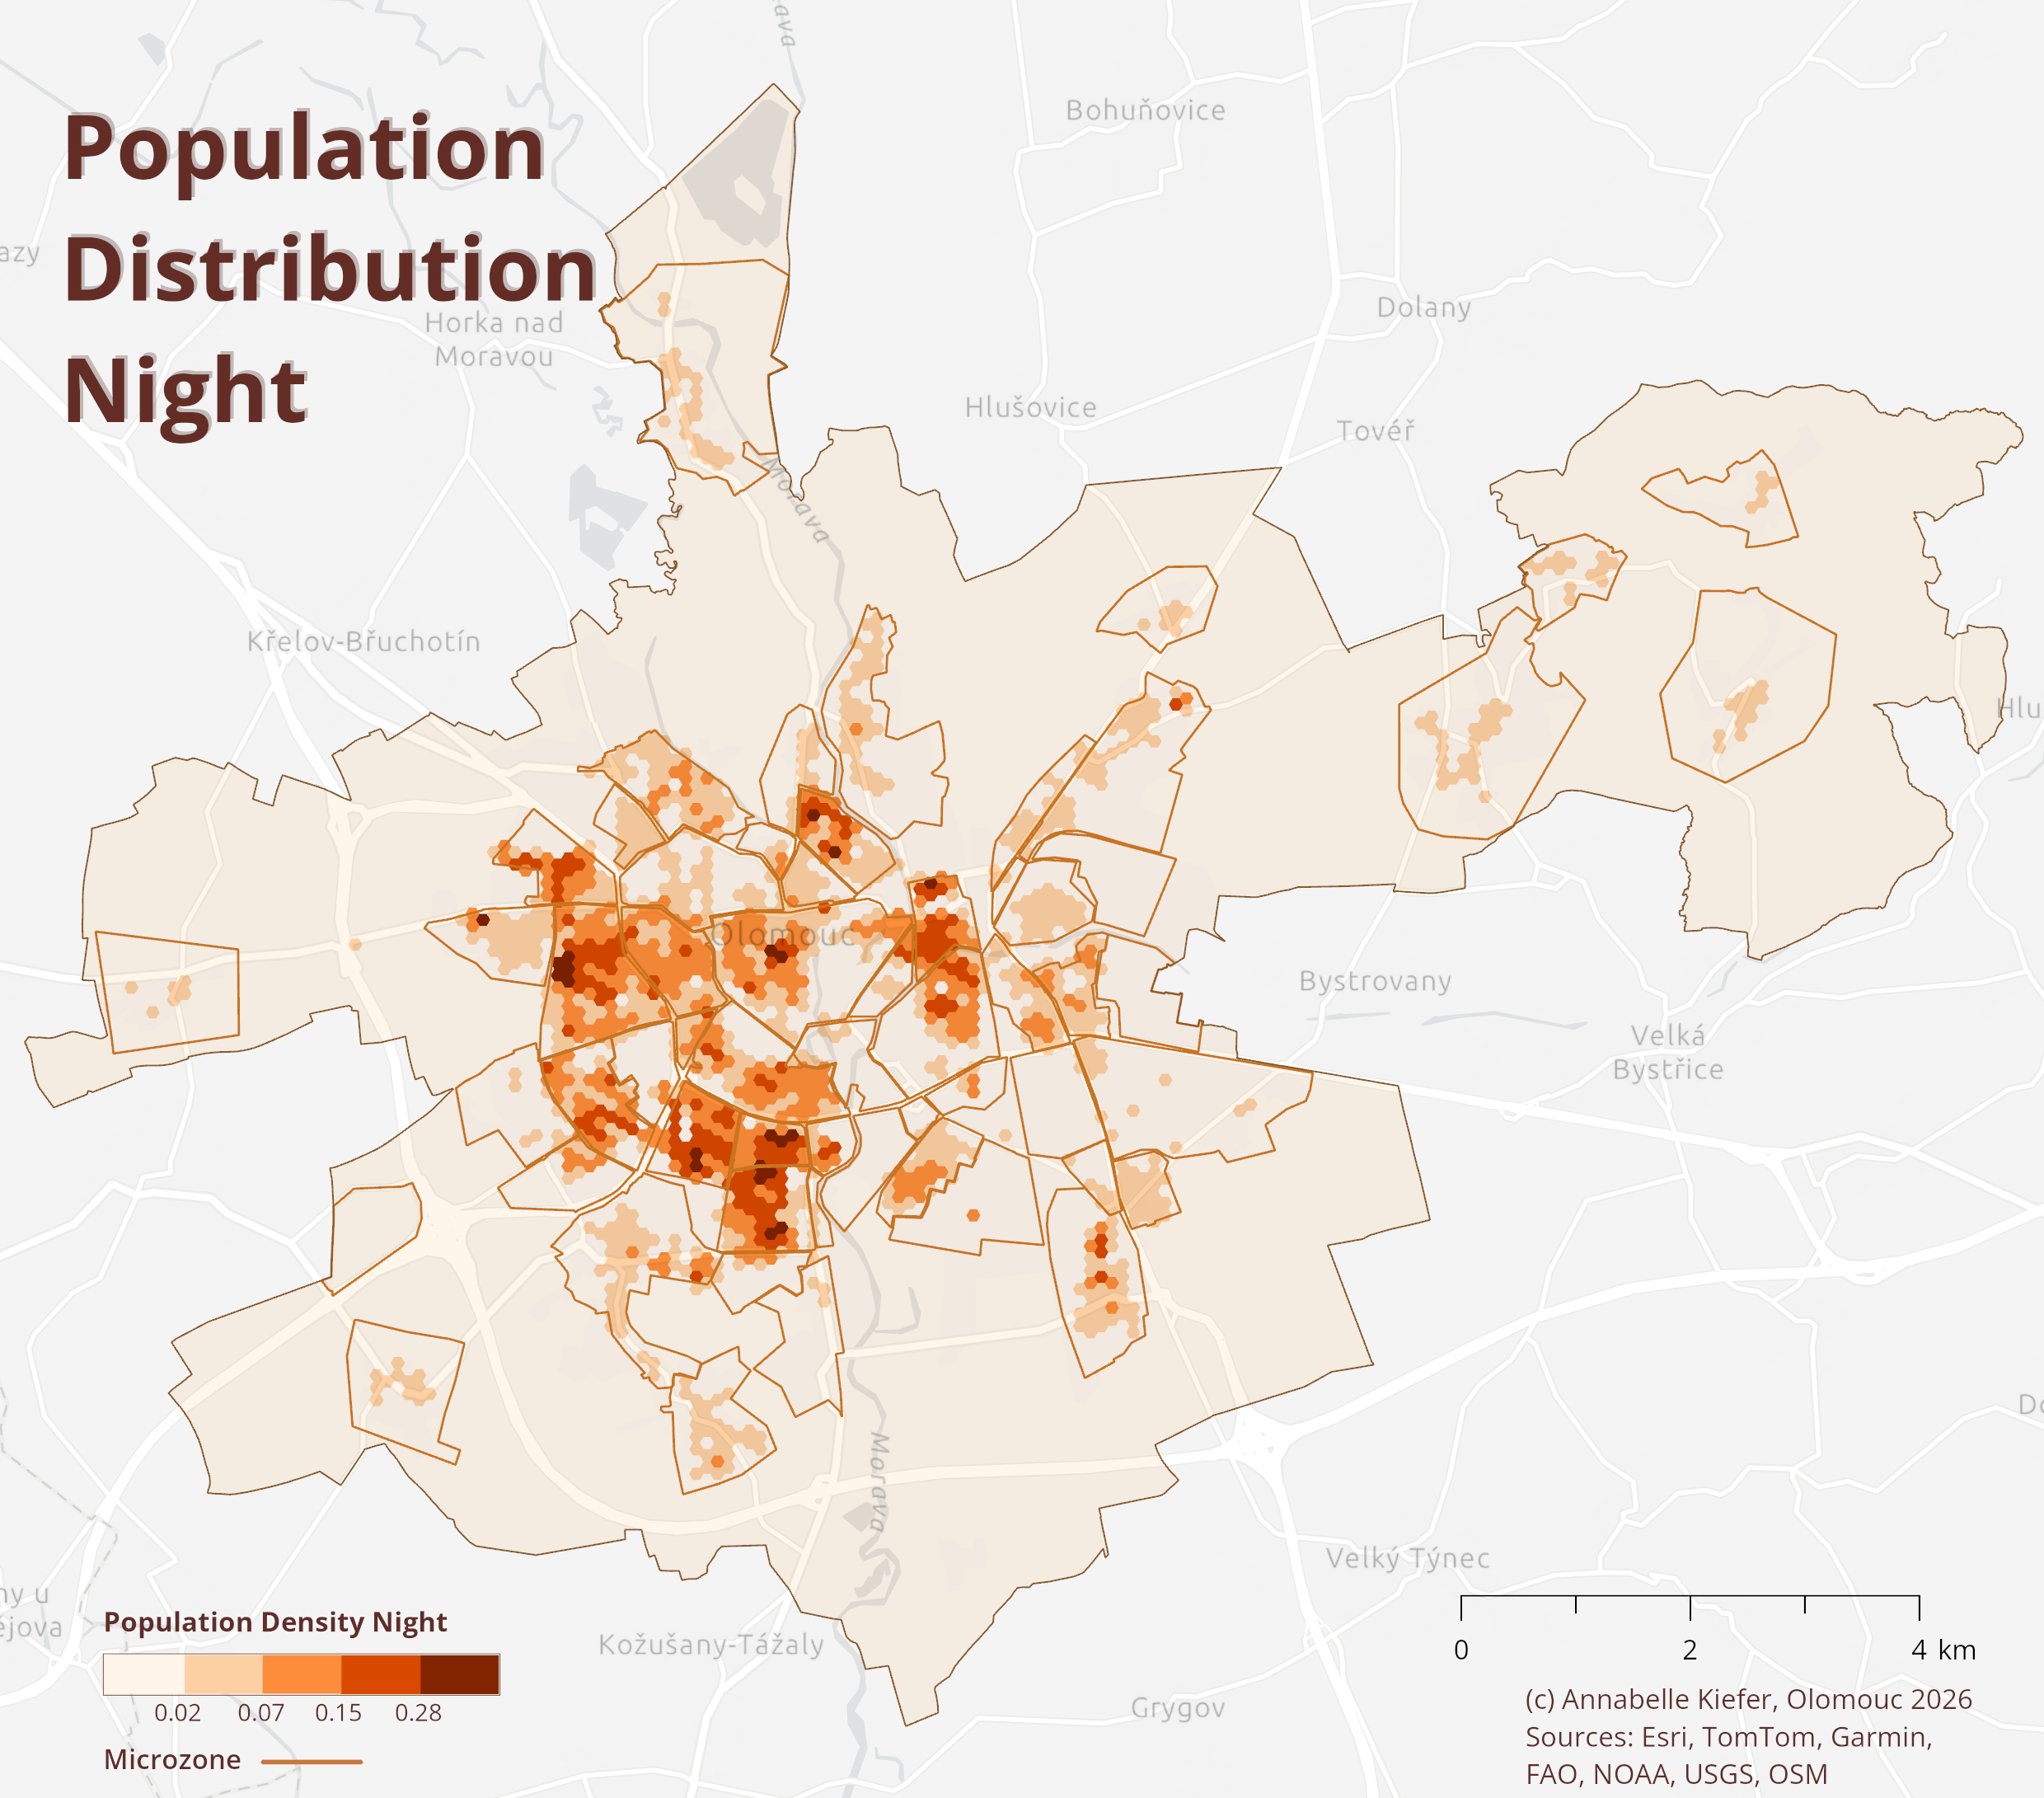
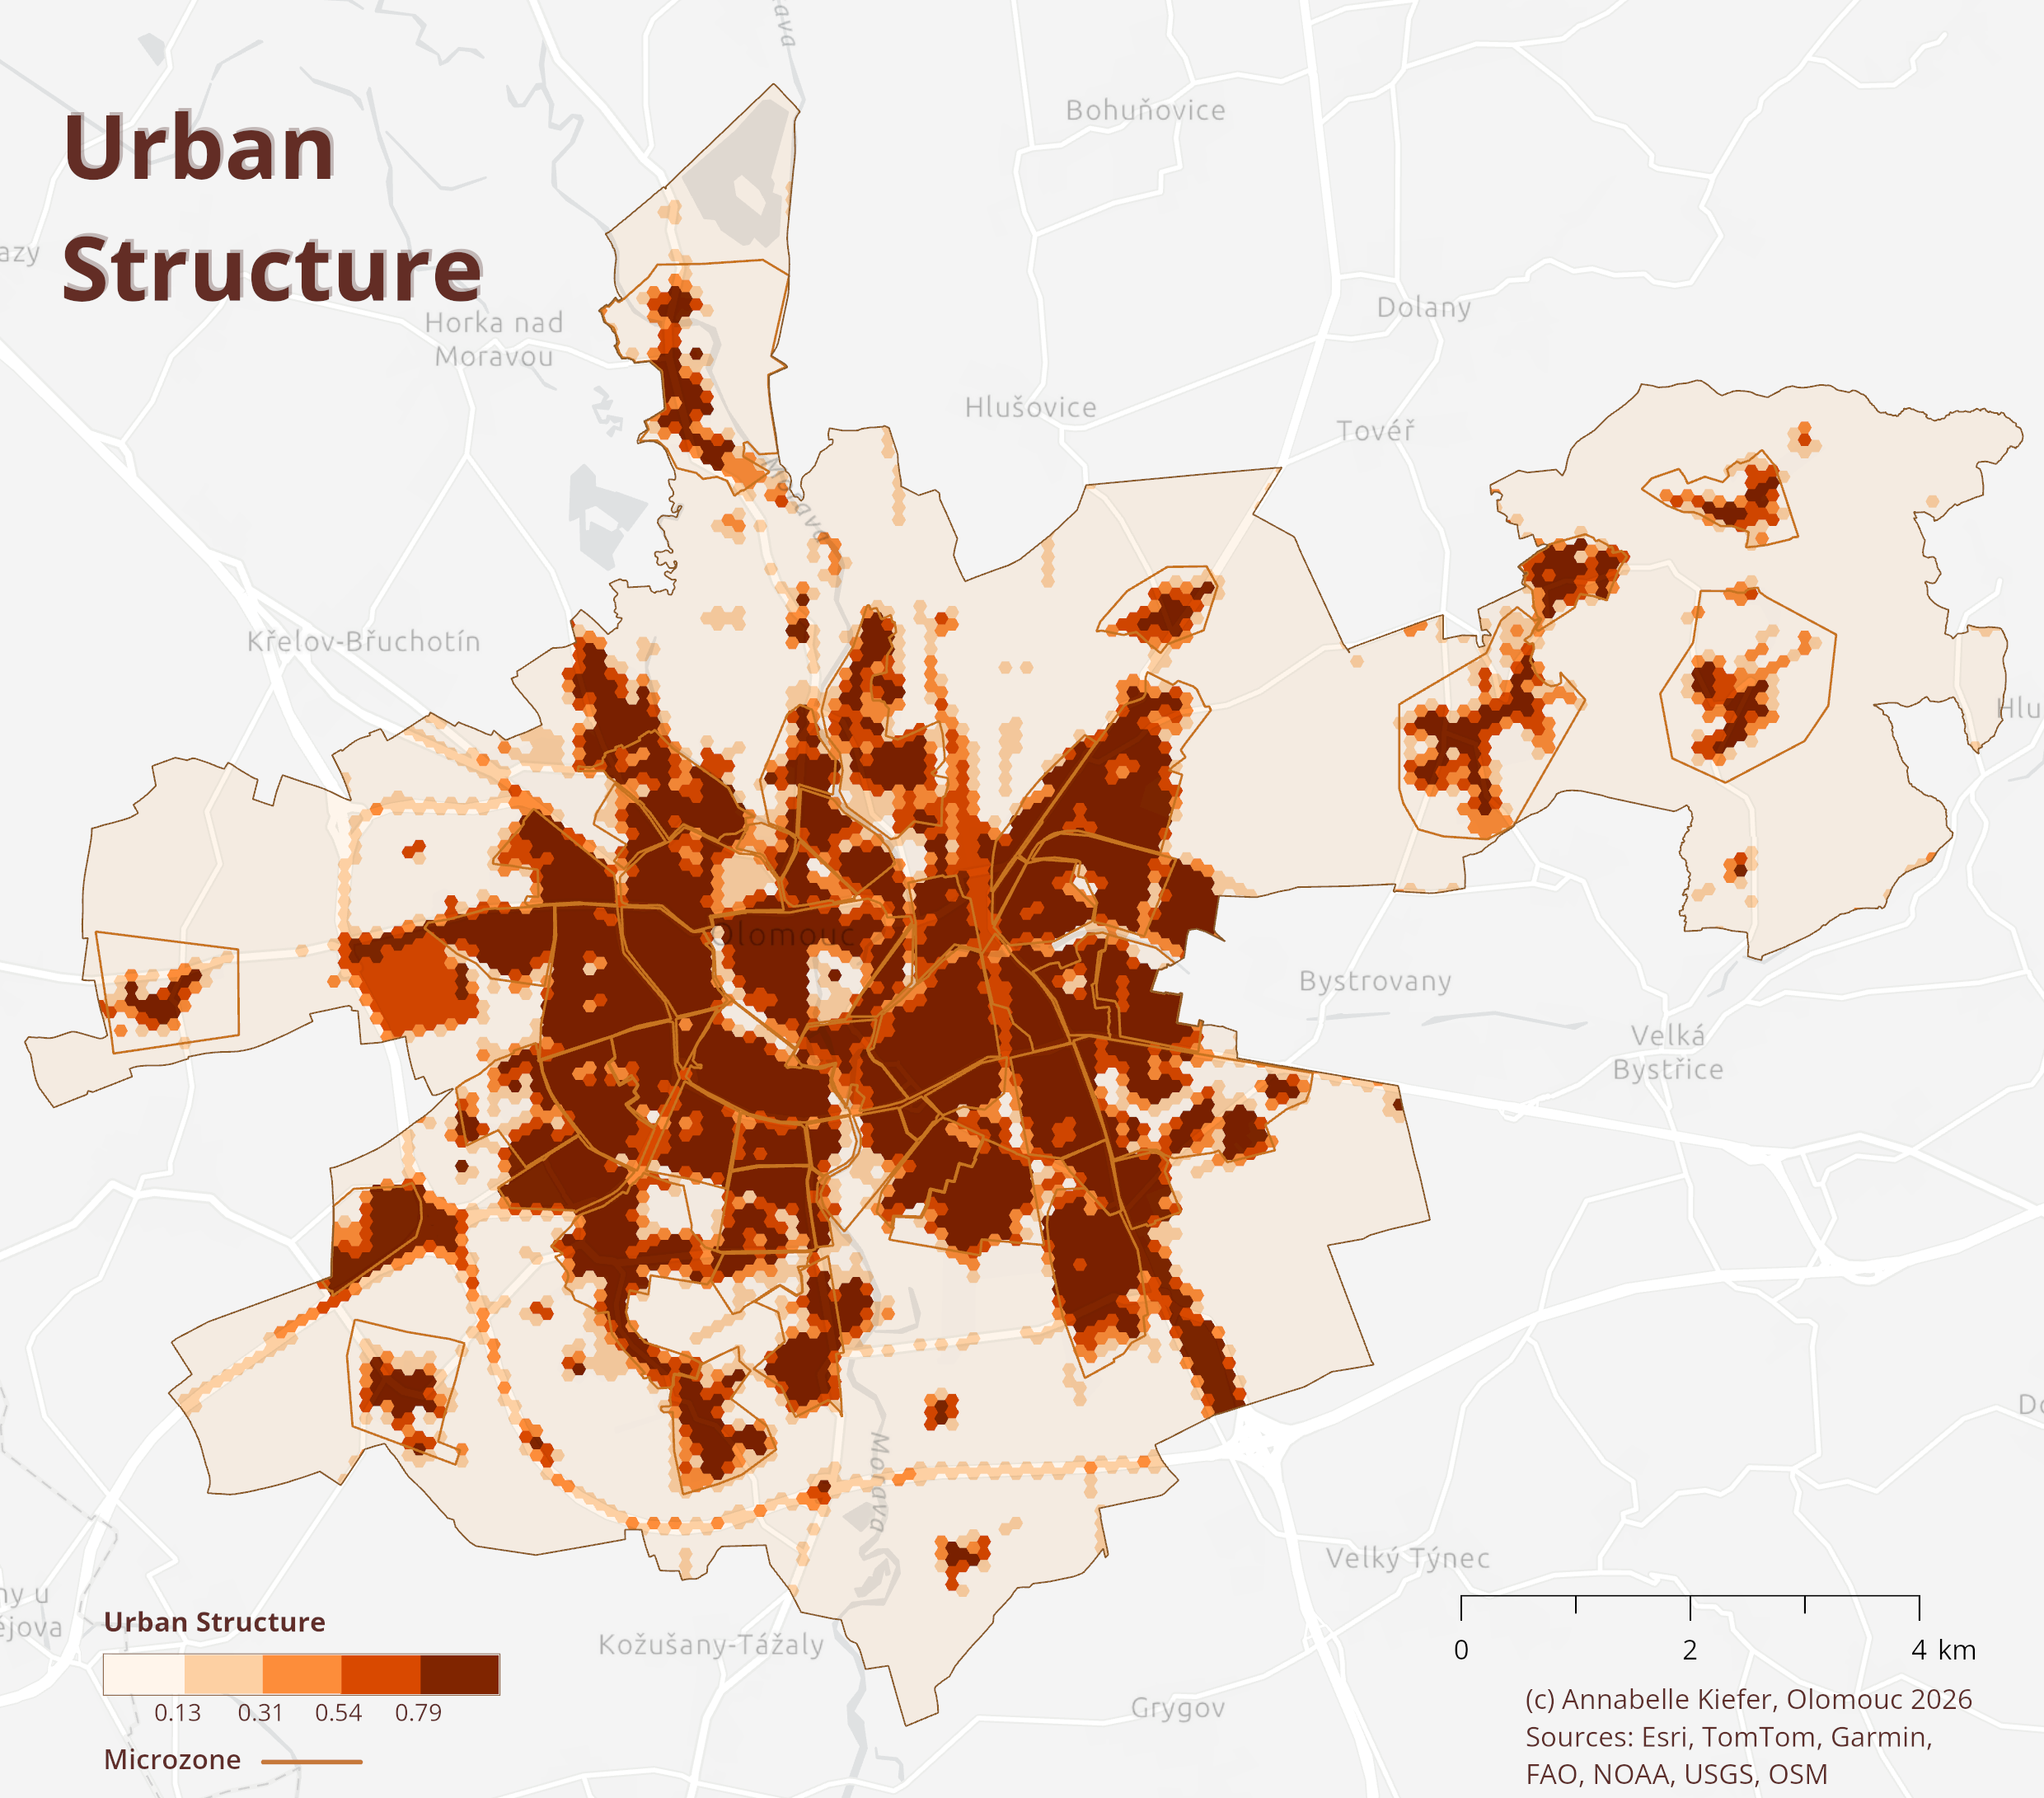
Figure 3 Population Distribution during the Day.Figure 4 Population Distribution during the Night.Figure 5 Urban Structure acquired from Urban Atlas.
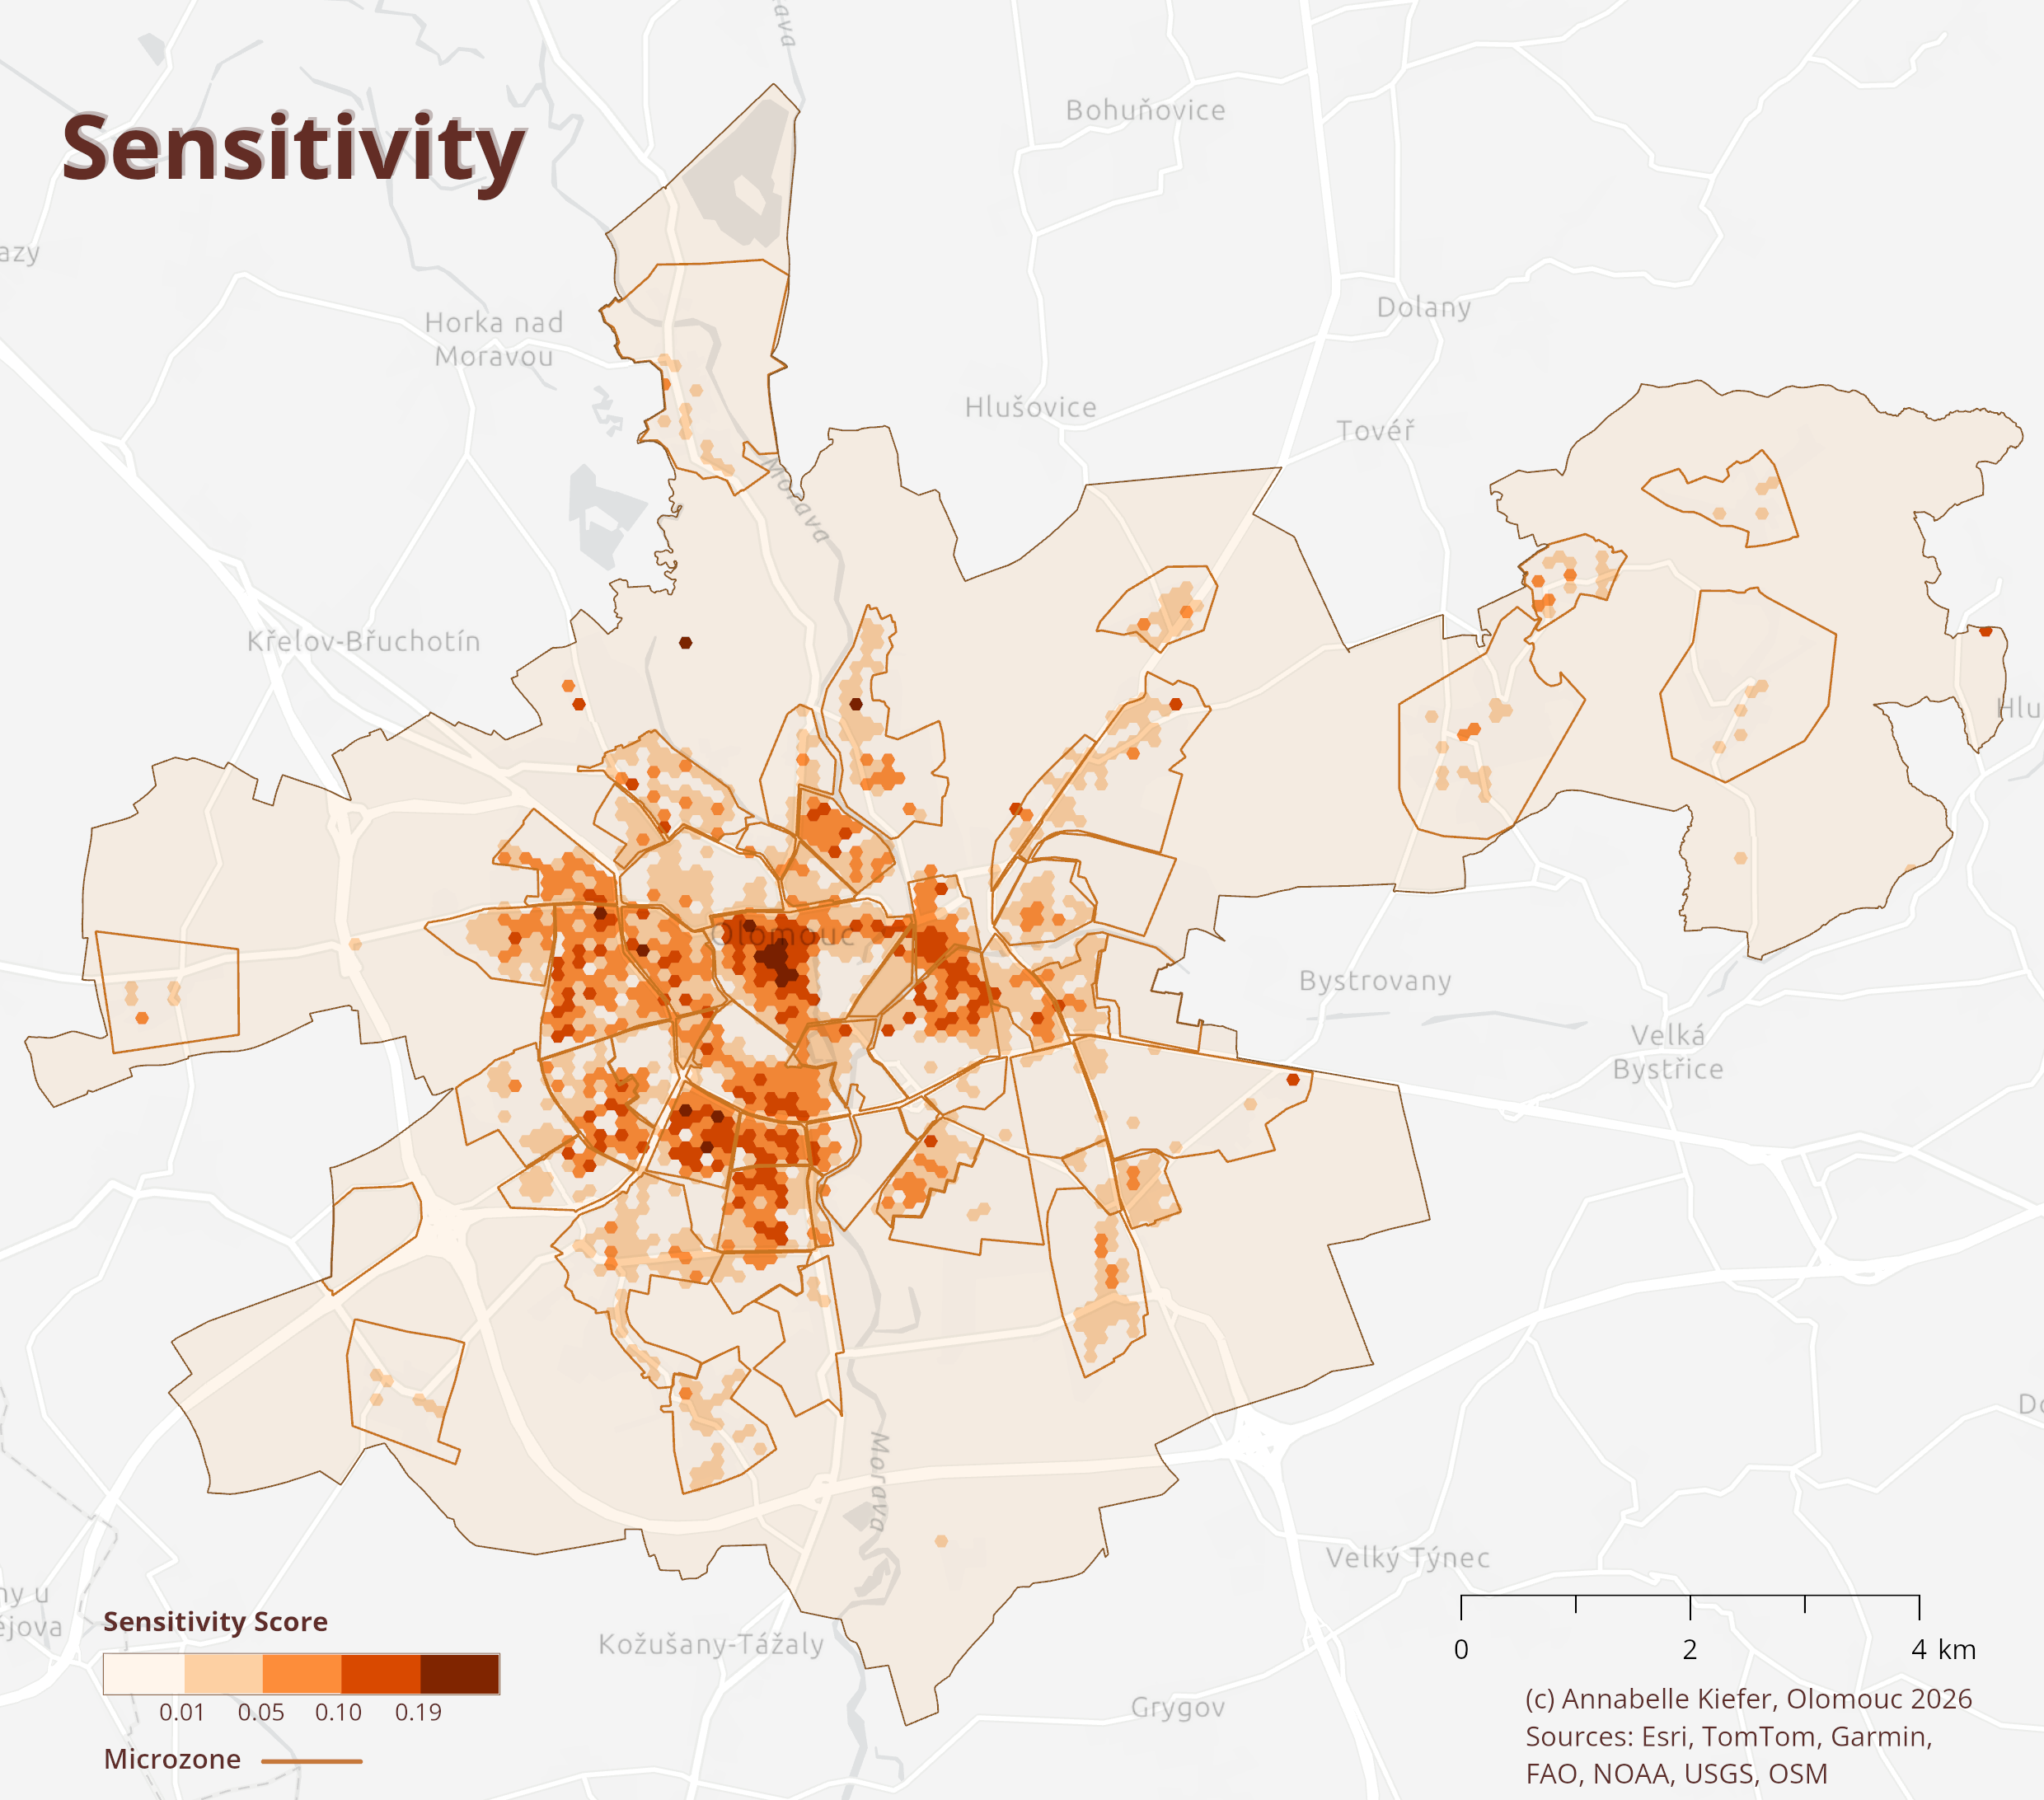
Sensitivity
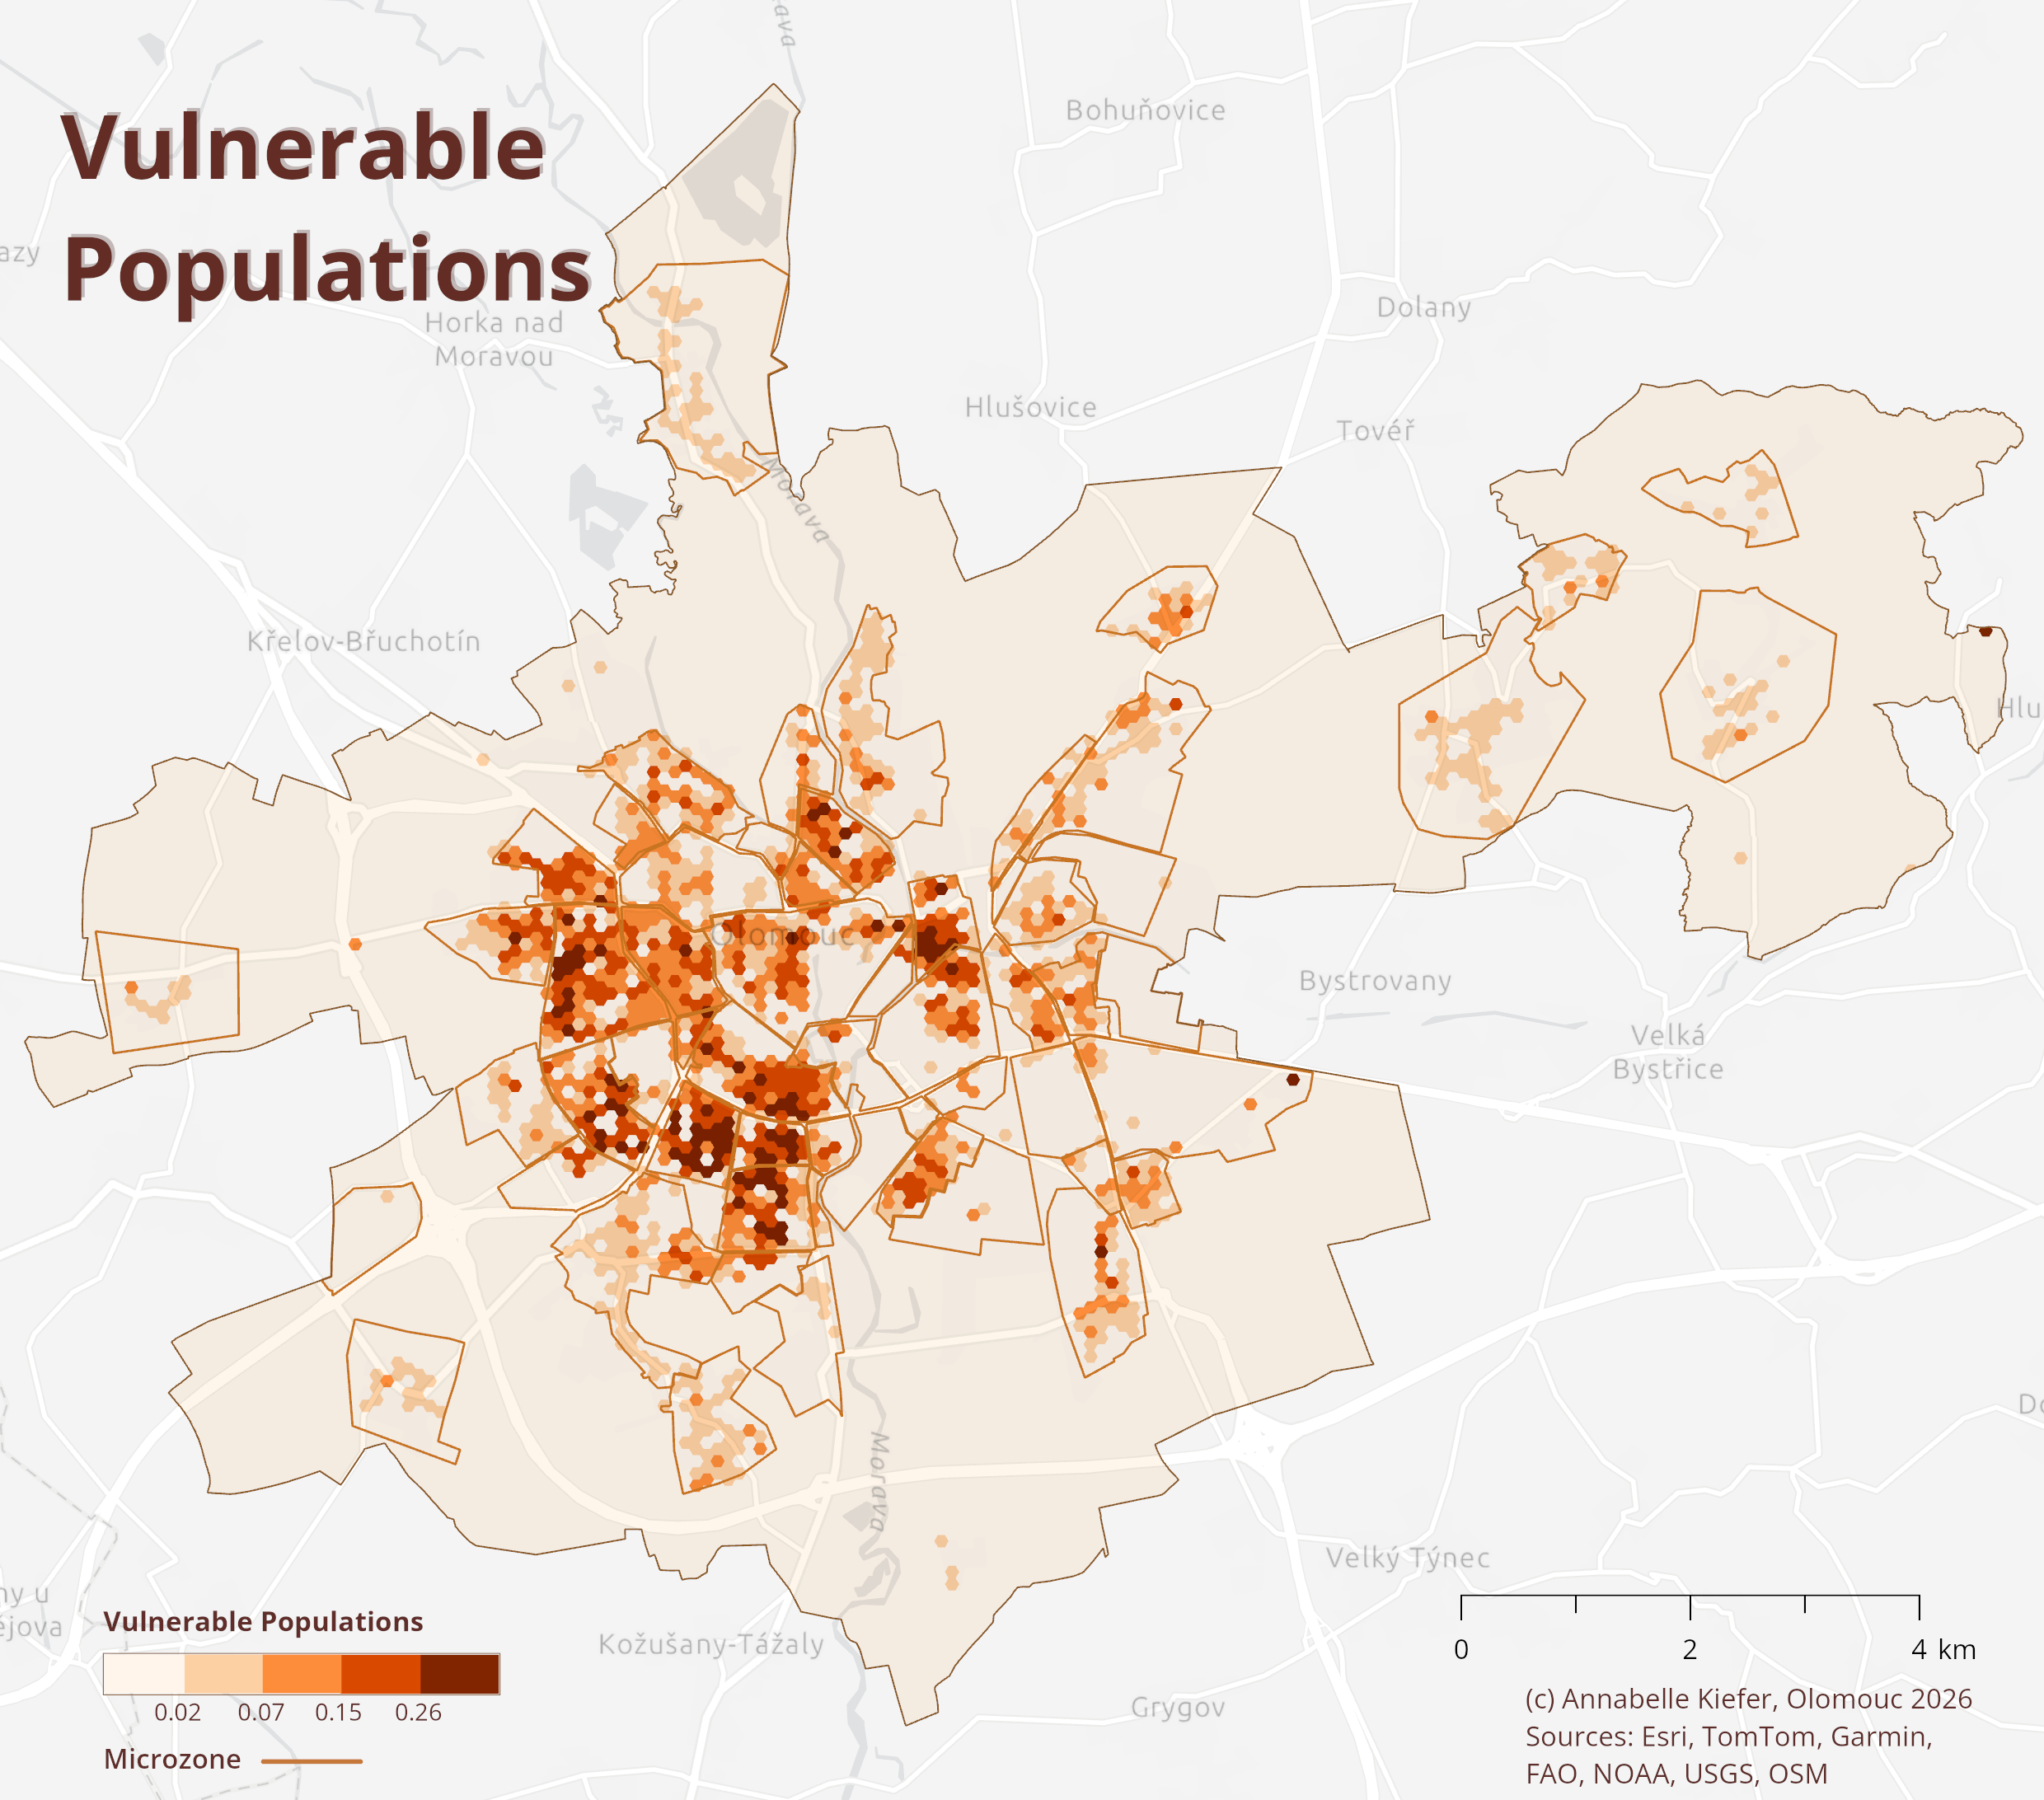
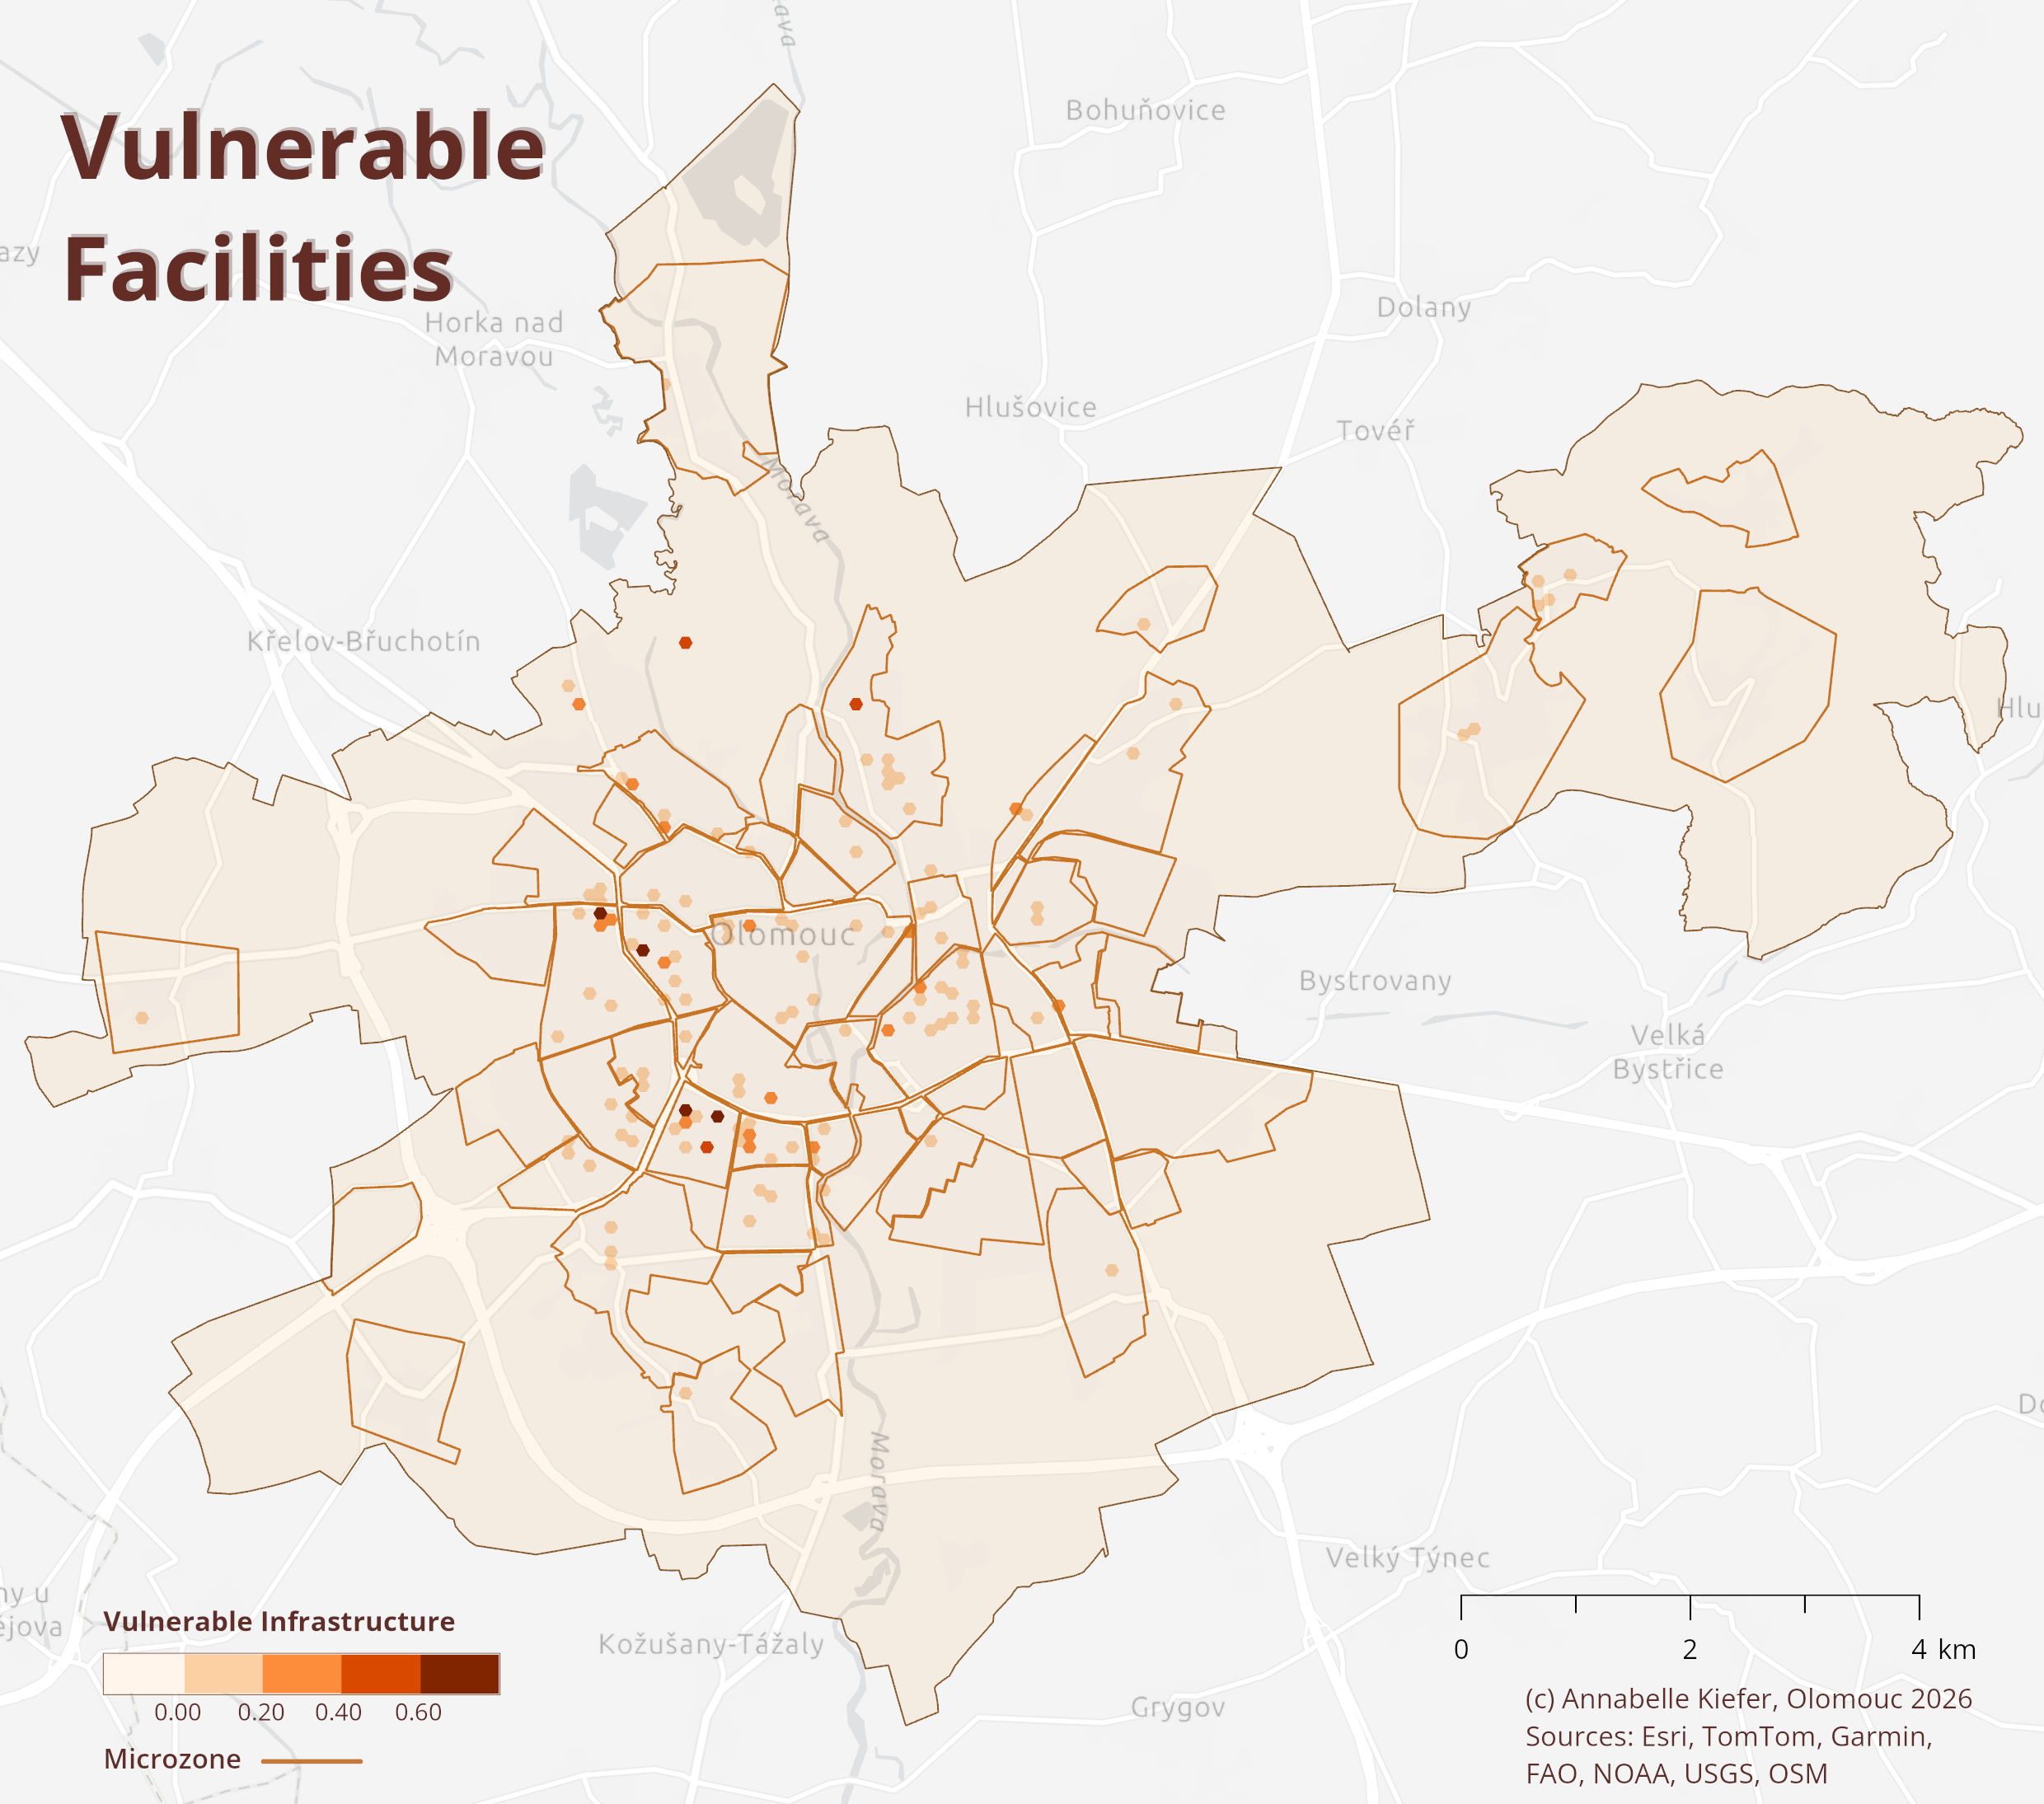
Figure 6 Vulnerable Population (Children, the Elderly, Women and People with low Educational Status).Figure 7 Vulnerable Infrastructure (Schools, Kindergartens, Hospitals and Retirement Homes).Figure 8 Reported Thermal Discomfort Score.