Methodology
An overview of the employed methods, used apparatus and software, and how they are integrated in the procedure.
Used Methods for User Evaluation
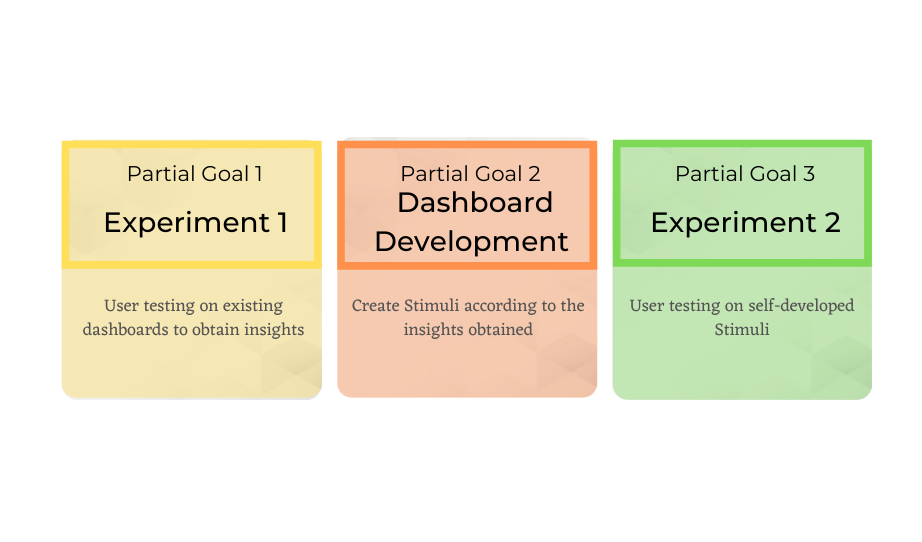
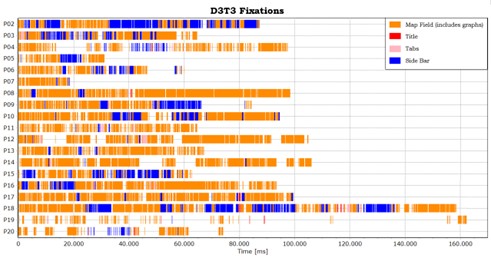
The experiment I is a formative study to analyse existing dashboards’ problematic aspects. As a quantitative method eye-tracking is used, and qualitative methods employed include an interview and a questionnaire .
The experiment II is also a formative study that compares self-developed dashboards and uses the same methodology as experiment I, adding a free viewing period of one minute for each dashboard. Both provide the following outcomes for analysis of the data:
Used Data for User Evaluation
For experiment I, four existing dashboards are selected:
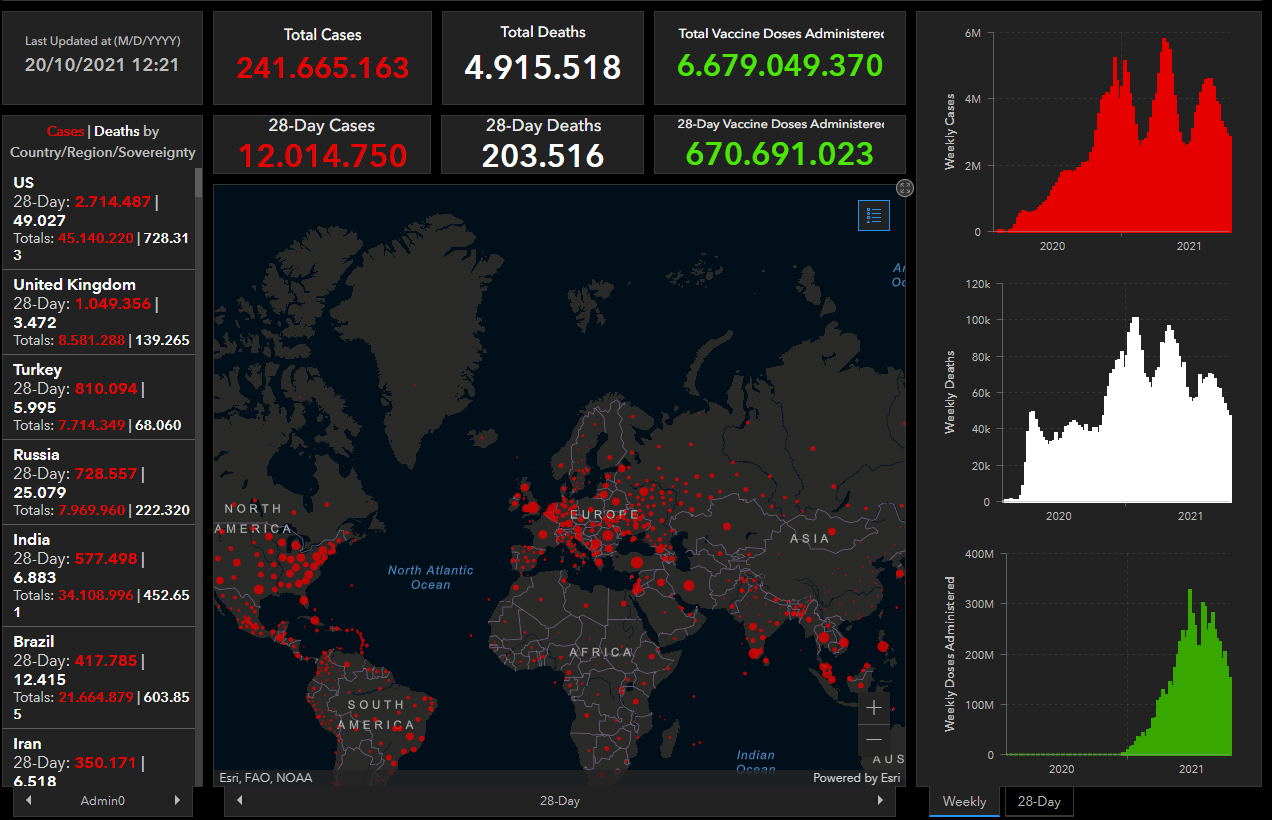
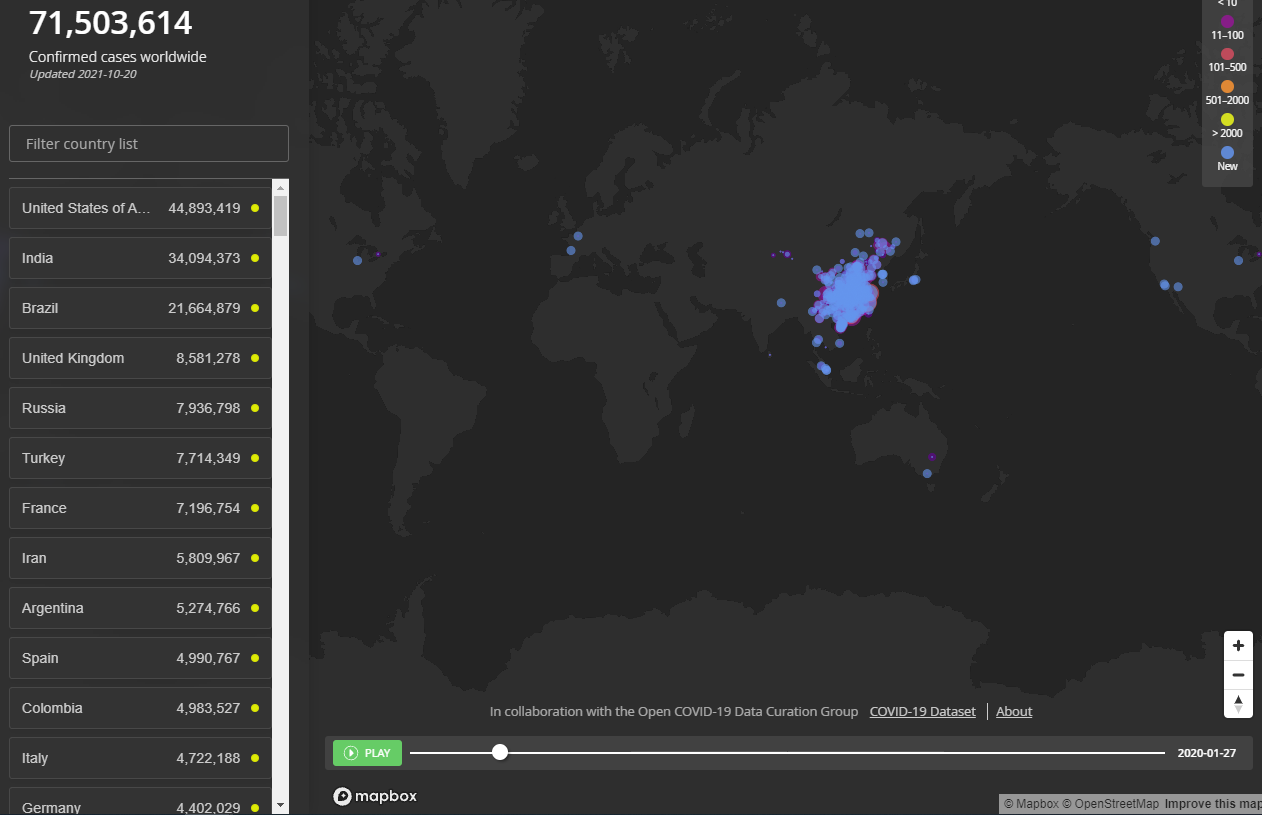
Covid-19 Map
by the John Hopkins University
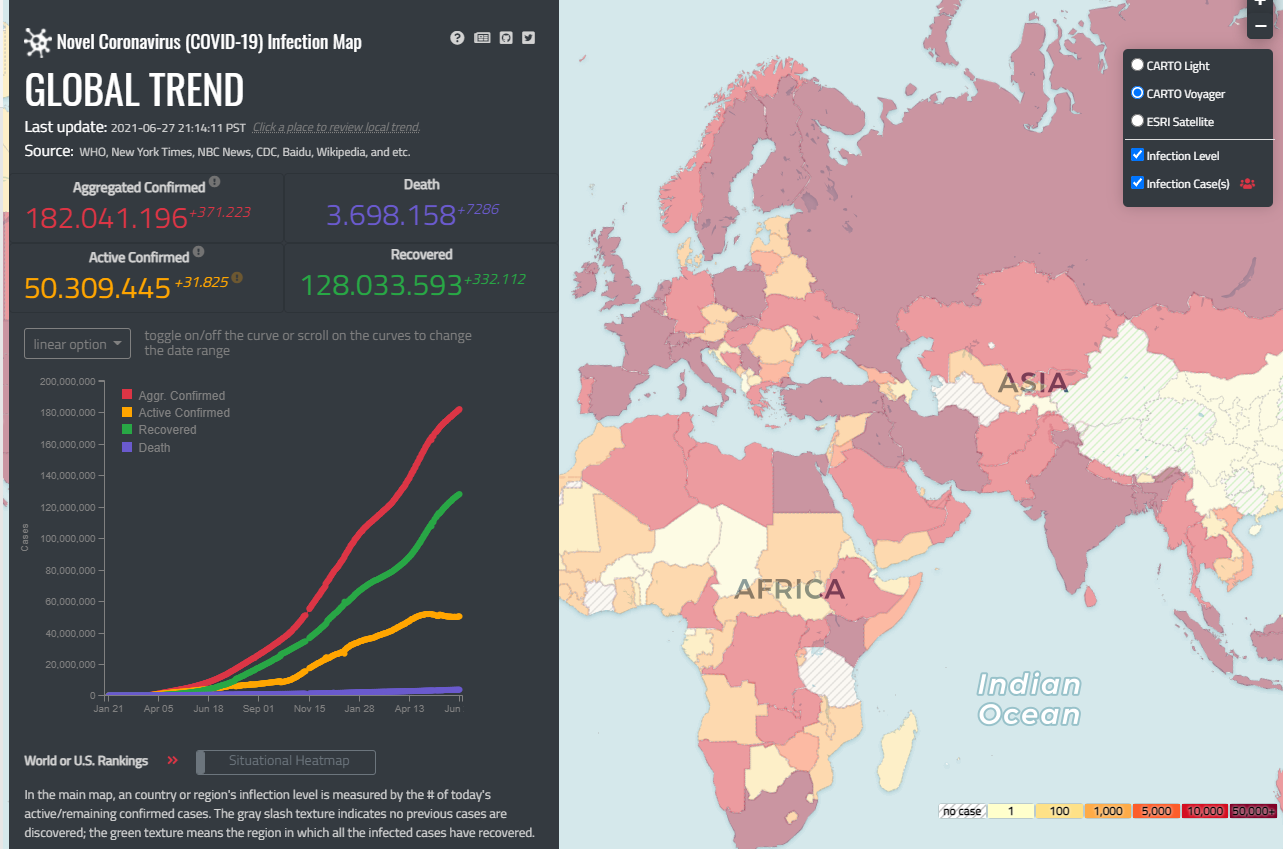
Novel C-19 Incidence Map
by the University of Washington
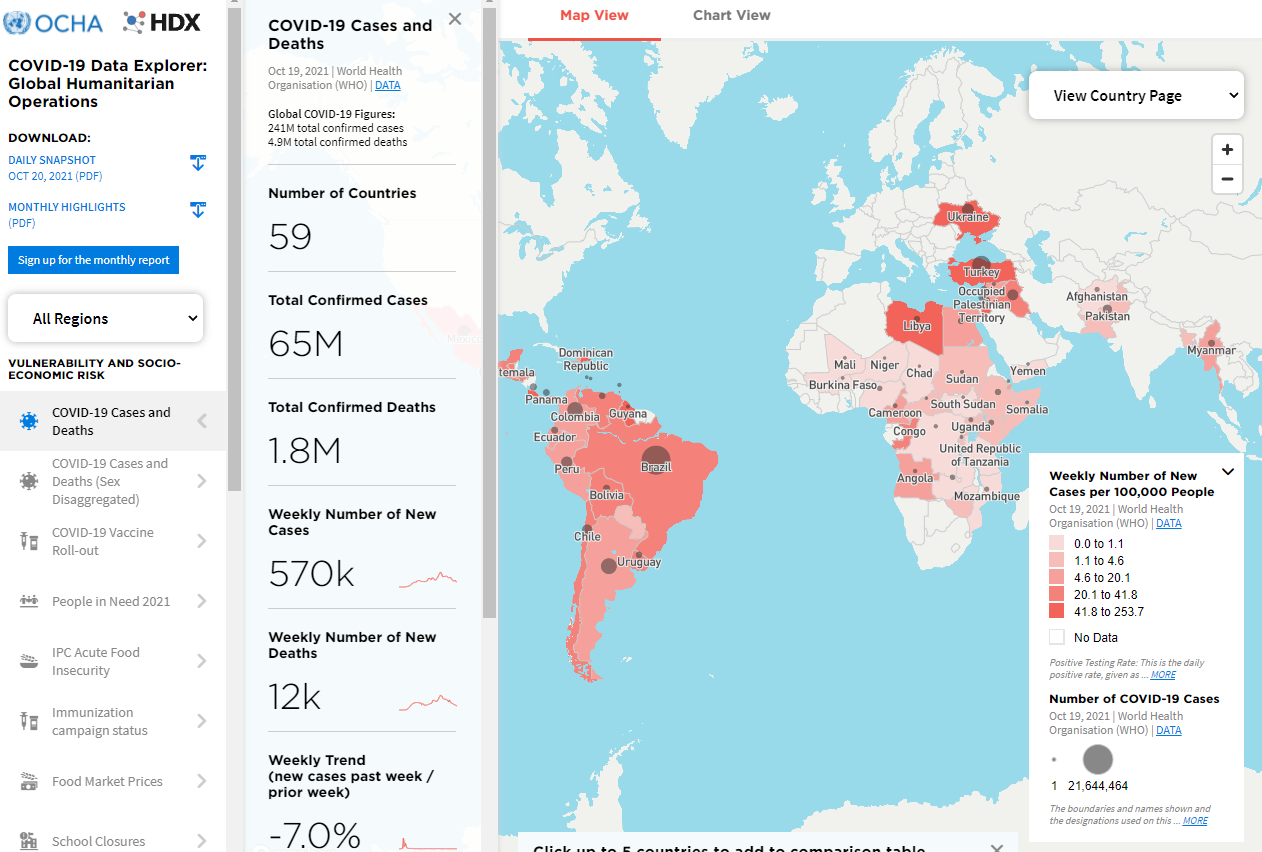
OCHA C-19 Data Explorer
by OCHA
The Health Map
by Health Map
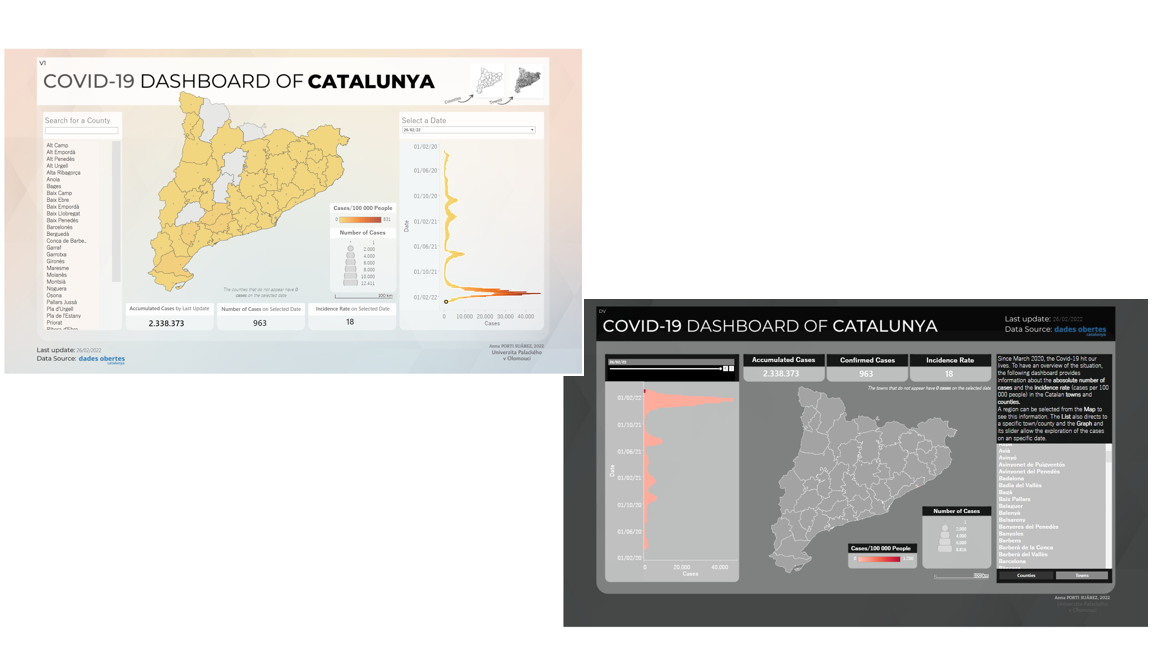
The experiment II uses two self-developed dashboards of the region of Catalunya. Their interfaces are purposely designed to contain the same functionalities in different ways to compare them. They are visible in the Results
Used Software for User Evaluation
The following tools are used for different stages:
- SMI Experiment Center was used for the design of the experiments
- iView X for data recording
- BeGaze 3.7 for data recording processing and analysis once the experiments are performed and the data is recorded in both cases
- SMI RED 250 as the employed apparatus to record the eye movement
Used Methods and Software for Dashboard Development
The self-developed dashboards are the visual interface of a spatial data infrastructure that is result of a compound of technologies:
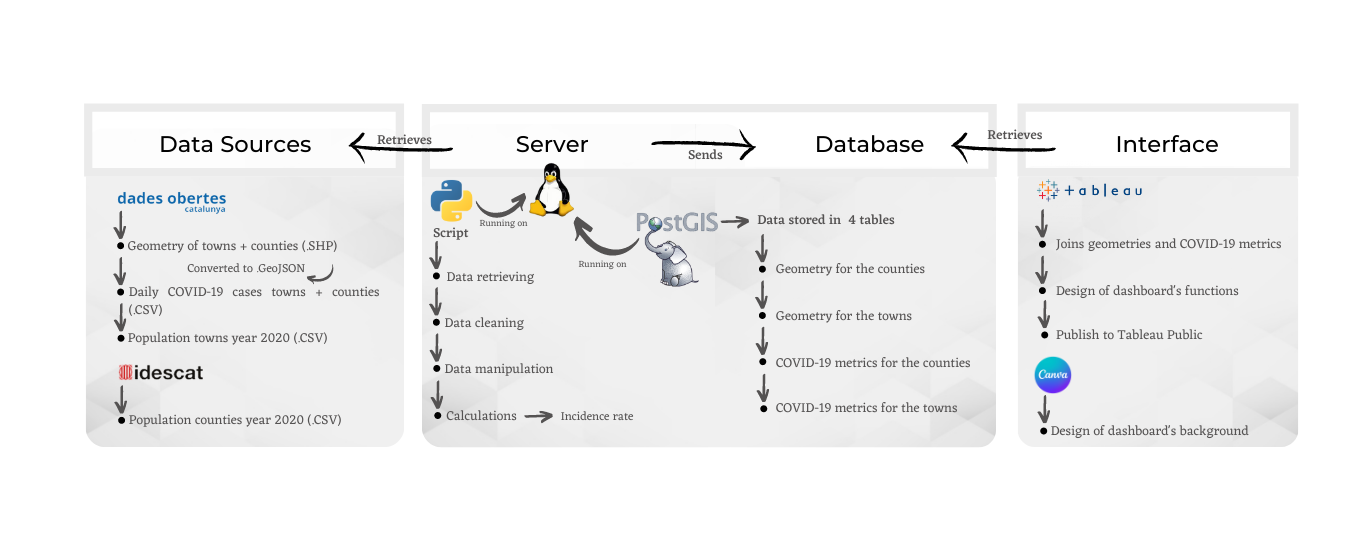
- The backend consists of: a Linux Server with Python scripts running and PostGreSQL’s PostGIS, the spatial database extension that allows the storage of geometries.
- The middleware is implicit in the Tableau, which has a framework allowing the communication between server and front-end user interface.
- The frontend is displayed using: Tableau’s desktop application that retrieves data and allows the creation of dashboard interfaces and Canva to design the background of the dashboards.
Used Data for Dashboard Development
The dashboards retrieve data from two Catalan public institutions:
The data refers to the number of COVID-19 cases from 01.03.2020 in CSV format, the population (to calculate the incidence rate), also in CSV format, and the administrative boundaries of the counties and the towns, as a shapefile.