Introduction
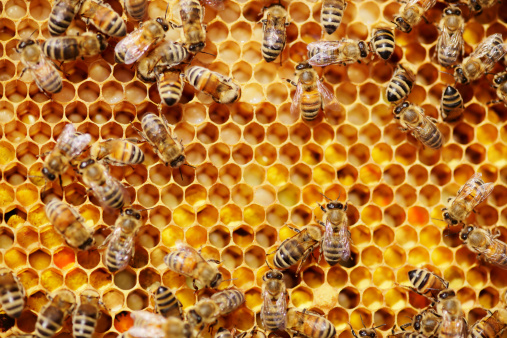
Bees (Apis), as one of the most important pollinators in nature, are of significant economic and ecological value,
contributing a lot in both global food safety and the maintenance of rich biodiversity. According to the report from the
International Union for Conservation of Nature (IUCN), 78% floral resource and 84% crops in the European Union rely
partially or fully on animal pollination, of which bees account for the majority. However, many scientific researches
and international associations have reported a concerning reduction in the health of bee population. For instance, over
9% of European bee species are reported by the IUCN to face the risk of extinction (Nieto, 2014), and multiple surveys
in Europe (Bommarco et al., 2012; Rasmont et al., 2015) have revealed decline in distribution and population of many bee
species over the course of this century (Cameron & Sadd, 2020). All these findings point to the urgency and necessity to
study the reasons behind the bee crisis. Fundamental studies dedicated to exploring the causes of death and effects of
human-induced environmental change, will be required to understand the reasons favoring bee population reduction.
The causes for the decline mentioned previously can be habitat loss, pesticide use, invasive species, climate change,
etc. (Brown & Paxton, 2009). And among all these factors, this study focuses on evaluating the patterns of climate
change as a factor that might affect bee abundance, since climate change has become a growing concern on a planetary
scale. The change of climate conditions can affect the survival of bees in many ways: it can influence the behavior and
physiology of bees directly, have an indirect impact by changing the phenology of floral resource, or affect the disease
profiles and incidence of bees (Le Conte & Navajas, 2008).
Although there have been quite a few studies about the influence of climate change on beekeeing, e.g., Schmickl et al.
(2017) analyzed how climate conditions like temperature and precipitation influence bee mortality and Flores et al.
(2019) evaluated the effect of climate change on bee colonies. Most of these studies are carried out at a local scale
based on conventional data collection methods, which is an enormous endeavor with inherent limitations, considering the
fact that the bee crisis is happening on a global scale. In fact, the advancement of earth observation could fill this
research gap effortlessly due to its nature of global coverage and massive data volume, whereas the application of earth
observation data in the context of likely climate change and beekeeping support stays fairly understudied. The reason
could be that many bee experts specialize in entomology or biology, and have very little knowledge of the latest
advances in remote sensing science. With these problems being stated, this diploma thesis aims to provide new insights
into how earth observation data can be used to benefit the current situation of bees, to give bee experts an overview of
the methodologies that can be applied to analyze earth observation datasets related to bee health, and to reveal the
possibilities of breaking through the limitations of traditional research in terms of spatial and temporal scale.
Reference
Nieto, A. (2014). European red list of bees.
Bommarco, R., Lundin, O., Smith, H. G., & Rundlöf, M. (2012). Drastic historic shifts in bumble-bee community
composition in Sweden. Proceedings of the Royal Society B: Biological Sciences, 279(1727), 309-315.
Rasmont, P., Franzén, M., Lecocq, T., Harpke, A., Roberts, S. P., Biesmeijer, J. C., ... & Schweiger, O. (2015).
Climatic risk and distribution atlas of European bumblebees (Vol. 10, pp. 1-236). Pensoft Publishers.
Cameron, S. A., & Sadd, B. M. (2020). Global trends in bumble bee health. Annual review of entomology, 65, 209-232.
Brown, M. J., & Paxton, R. J. (2009). The conservation of bees: a global perspective. Apidologie, 40(3), 410-416.
Le Conte, Y., & Navajas, M. (2008). Climate change: impact on honey bee populations and diseases. Revue Scientifique
et
Technique-Office International des Epizooties, 27(2), 499-510.
Schmickl, T., & Switanek, M., Crailsheim, K., Truhetz, H., & Brodschneider, R. (2017). Modelling seasonal effects of
temperature and precipitation on honey bee winter mortality in a temperate climate. Science of the Total
Environment,
579, 1581-1587.
Flores, J. M., Gil-Lebrero, S., Gámiz, V., Rodríguez, M. I., Ortiz, M. A., & Quiles, F. J. (2019). Effect of the
climate
change on honey bee colonies in a temperate Mediterranean zone assessed through remote hive weight monitoring system
in
conjunction with exhaustive colonies assessment. Science of the Total Environment, 653, 1111-1119.
Methodology
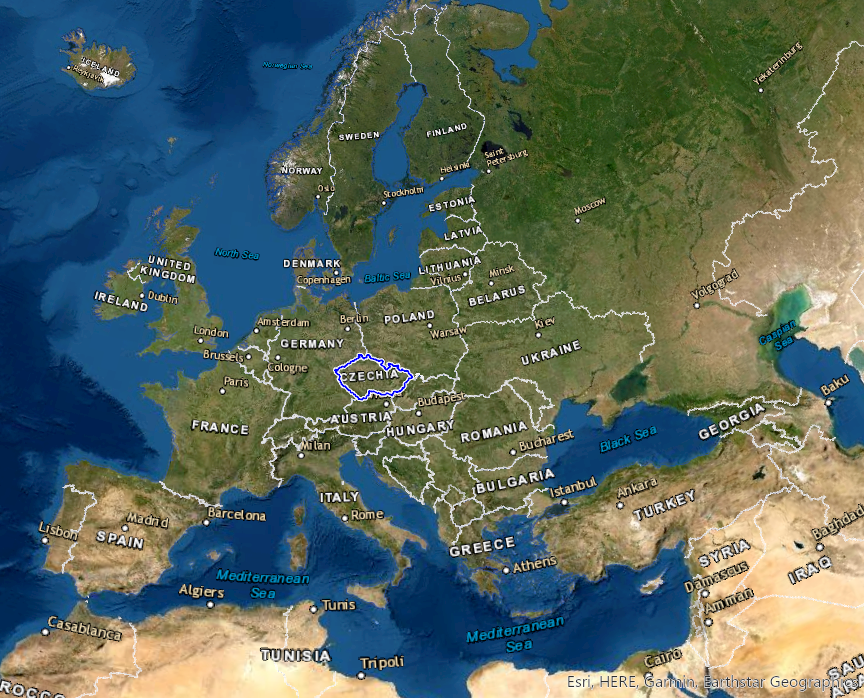
Study Area
The study area for the evaluation of climate change is the entire European continent, which is part of the Eurasian
continent and located to the west of Asia, with its west, north and south sides bordered by the Atlantic Ocean, the
Arctic Ocean and the Mediterranean Sea respectively. Most parts of Europe are located in the mid-latitudes of the north
temperate zone and belong to one the belts of westerly winds in the atmospheric circulation system. Therefore, the
climate there is heavily influenced by the Atlantic Ocean, dominated by a temperate oceanic climate which is mild and
humid throughout the year. And the study area for the assessment of climate change impacts on beekeeping the Czech
Republic (highlighted in the map), which is located in central Europe.
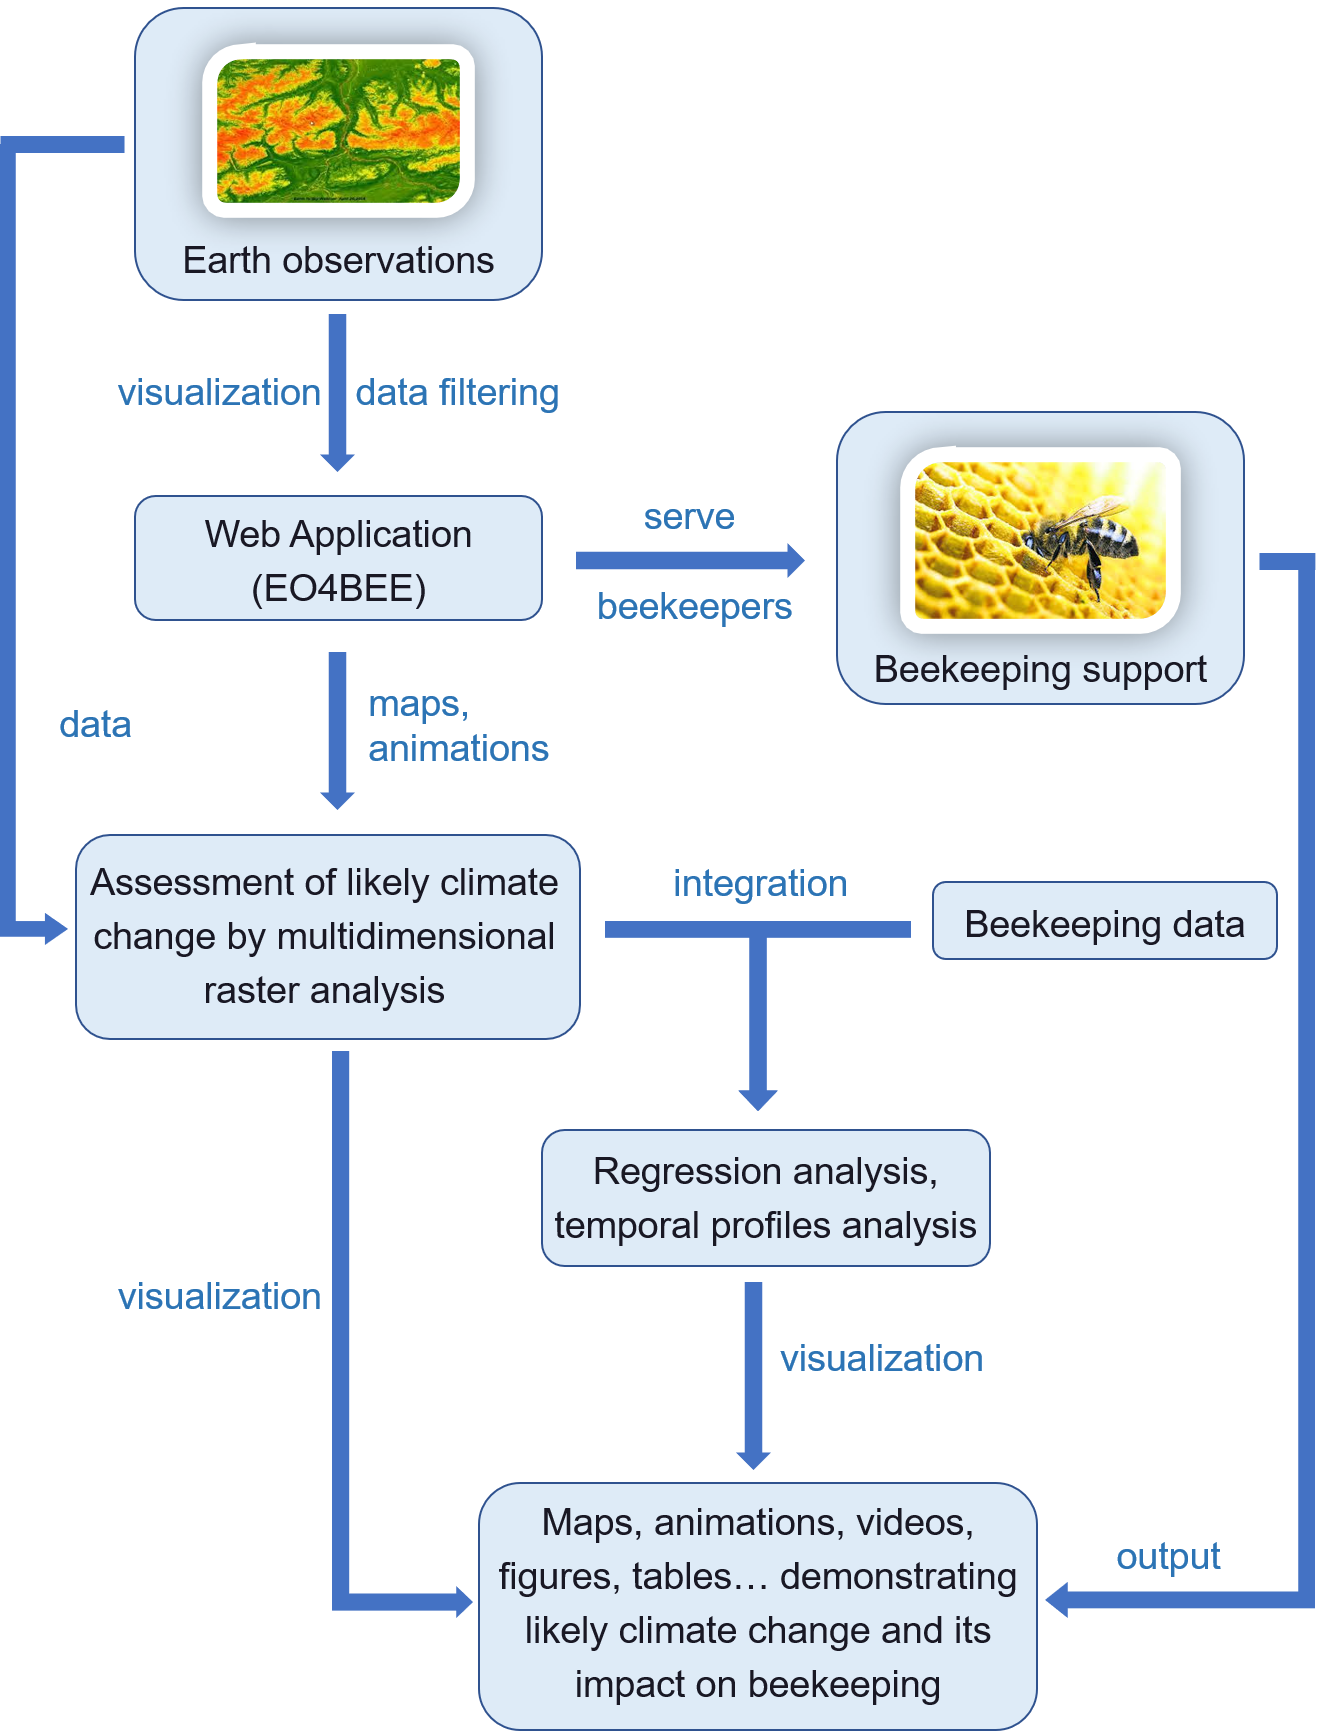
Workflow
The methodology of this study can basically be explained by the workflow figure below. First and foremost, datasets with
variables that have a relatively notable impact on the living environment of bees need to be sifted out from countless
earth observation datasets and then fed into the web application for beekeeping support. These filtered datasets are
then visualized in an interactive way in the web application, allowing the beekeepers, bee experts and enthusiasts to
inspect the climate conditions which are essential to the survival of bees not only at a large spatial scale, but also
for a long time period. The output of this web application together with the raw data from observations can be used in
multidimensional raster analysis, e.g., trend analysis and multidimensional principal components analysis, the result of
which can be further integrated with beekeeping data to assess possible impacts of likely climate change on bees.
Results
The results can be divided into two parts: the result
of the web application development and the results from the assessment of climate change and its possible impacts on
beekeeping. The web application part consists of the web app itself and the outputs from the web app including maps,
animations and videos. The results from the analysis part are comprised of maps, figures and tables demonstrating the
patterns and statistics of climate change in Europe as well as the possible association between climate change and
beekeeping.
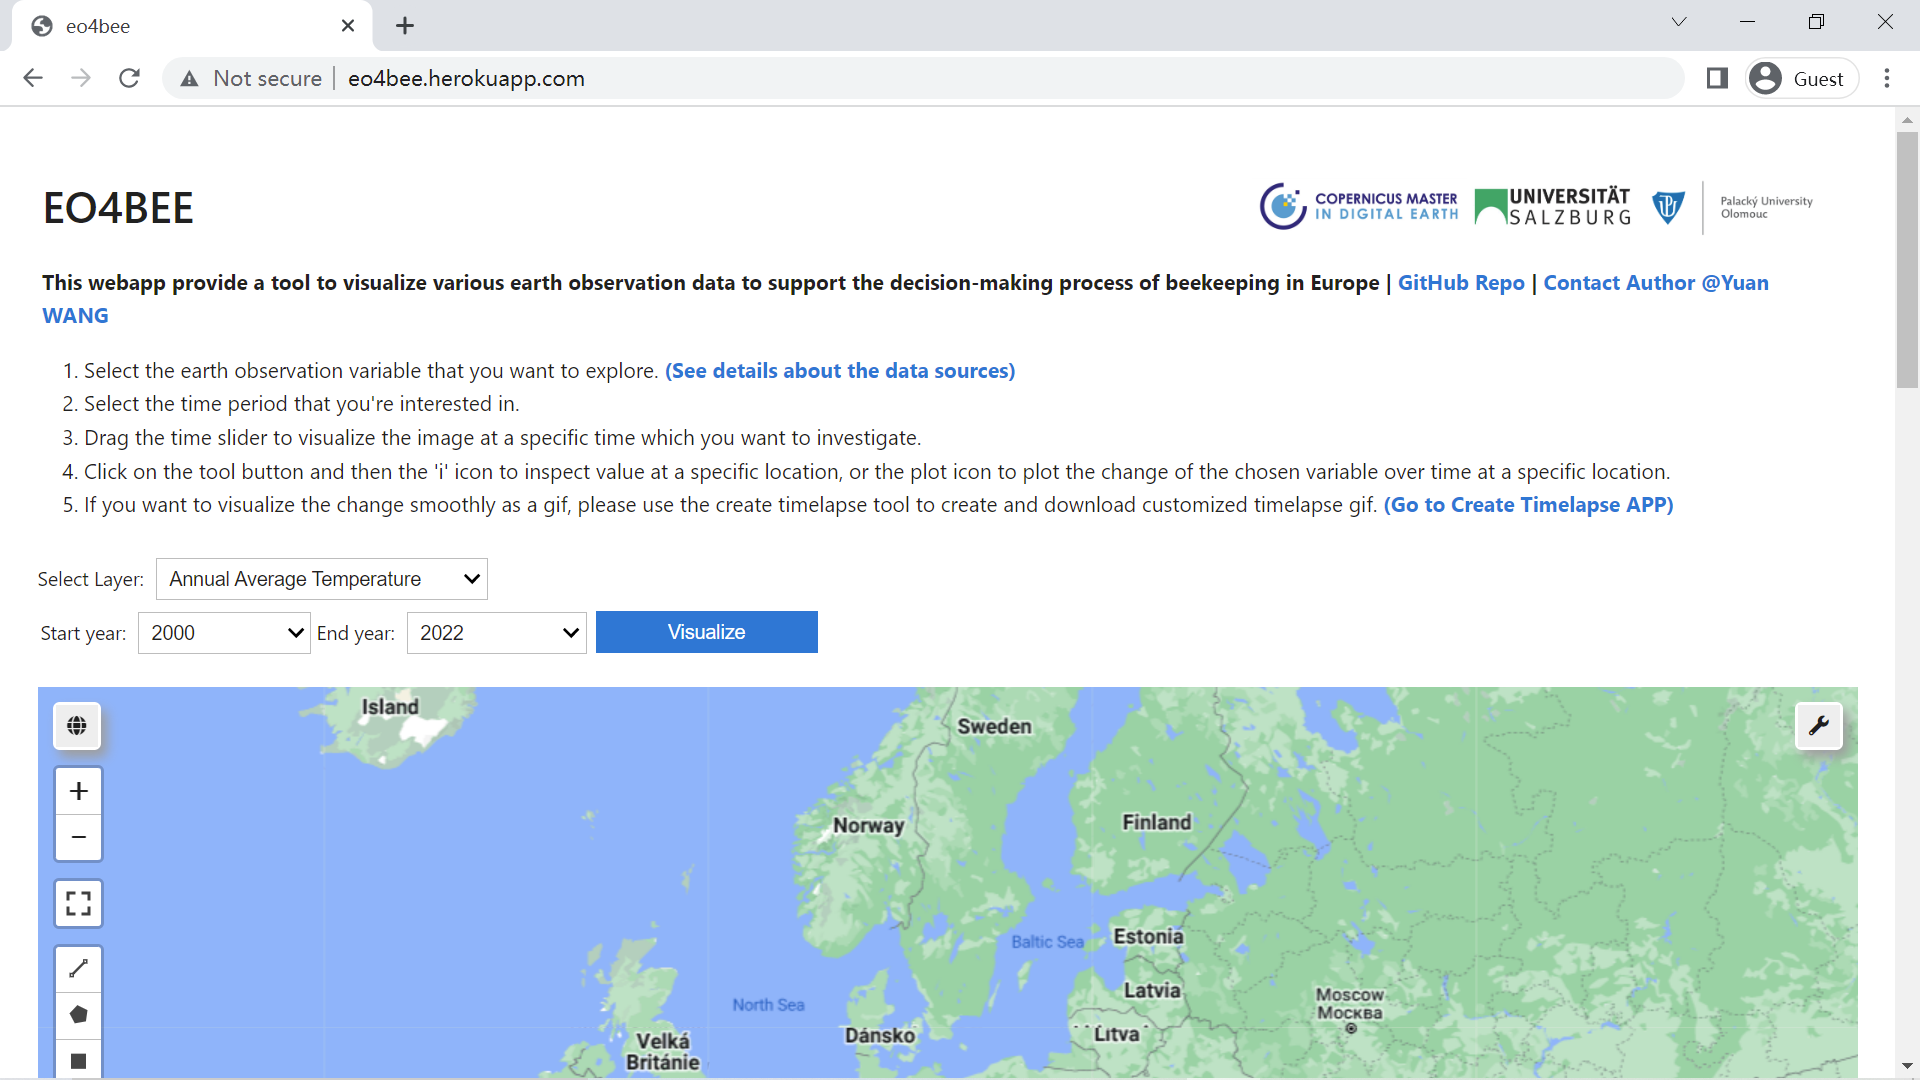
EO4BEE Web Application
Available at the URL: http://eo4bee.herokuapp.com/
Evaluation of climate change in Europe
trend analysis
multidimensional Principal components Analysis
Assessment of likely climate change impacts on beekeeping in Czech Republic
Trend Analysis
Regression Analysis
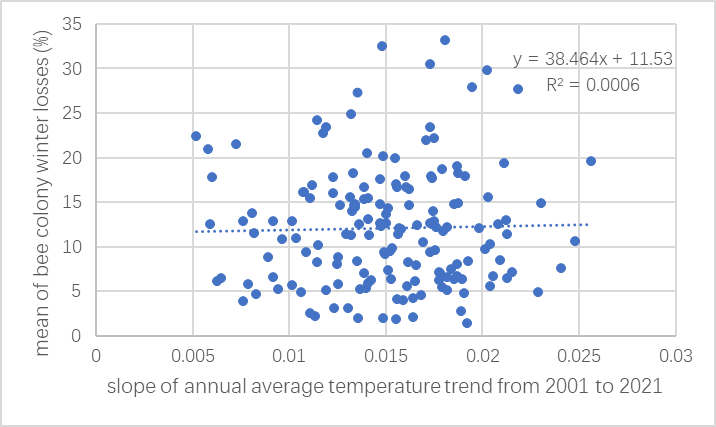
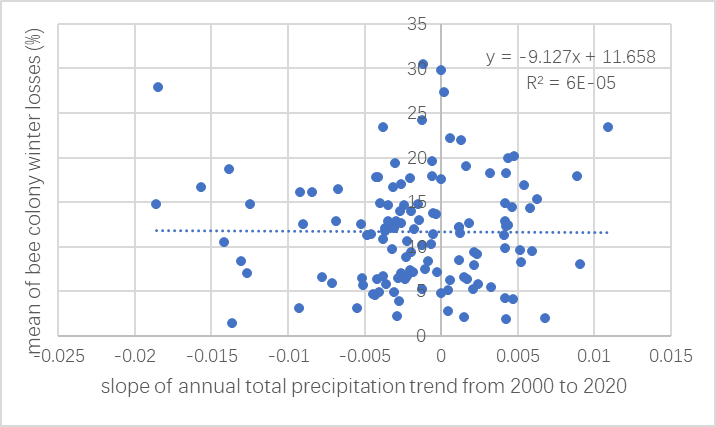
Regression analysis was conducted for 162 districts with valid bee colony data to explore how bee colony winter losses
are related to the temperature trend or the precipitation trend. The results for both regression analyses didn't show
statistically significant correlations.
Temporal Profile Analysis
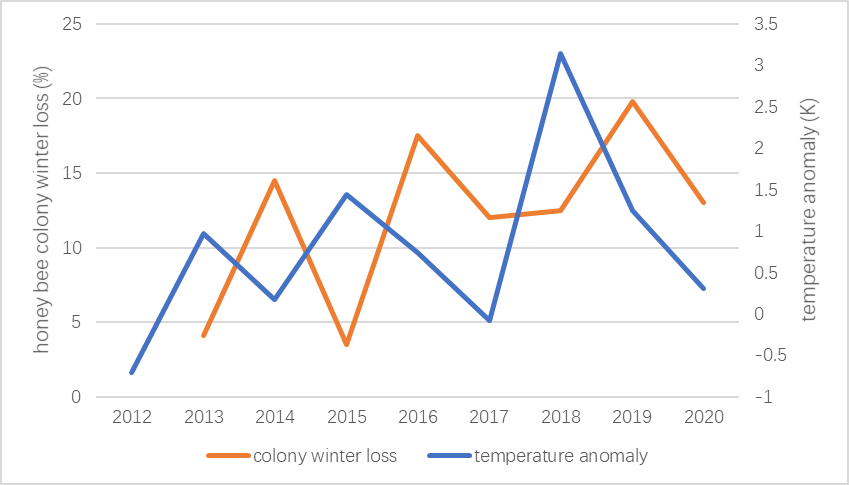
The fluctuations in bee colony winter losses have a similar pattern to the variation in temperature anomalies with one
year delay. The temperature anomalies had three peaks in 2013, 2015, and 2018, while the peaks of honey bee colony
winter losses can be observed in 2014, 2016, and 2019, and for both temperature anomaly and honey bee colony winter
loss, each of the three peaks are higher than the previous one.
Conclusion
The principal aim of this diploma thesis was to explore the potential of earth observation data in the context of
beekeeping and likely climate change. The practical objective was to develop a web application for beekeeping support by
utilizing the strong cloud computing power and huge earth observation data catalogue of GEE. And the Theoretical
objectives were to extract the spatial patterns of likely climate change in Europe from multidimensional raster obtained
by earth observation, to evaluate the possibility of integrating crowdsourced bee colony data with relevant earth
observation data, and to explore how the analysis results can benefit beekeeping research.
To achieve the practical goal of this study, a web application named "EO4BEE" has been developed using the geemap python
package and the Google Earth Engine python API in jupyter notebook. The web app was deployed to the Heroku cloud
platform and is available at the url: http://eo4bee.herokuapp.com. It managed to enable the time series visualization of
earth observation variables that might have an impact on bee health based on the implementation of a time slider, and
allow users to generate timelapse to have an overview of the changing pattern of the selected variable. The
visualization results from the web app can provide convenience for beekeepers and bee experts during the examination of
local living conditions and environment for bees so that they can make more informed decisions.
In terms of theoretical objectives, several multidimensional raster analyses have been applied to the time series raster
datasets of temperature and precipitation in ArcGIS Pro to investigate the patterns of likely climate change, the
results of which were further integrated with bee colony winter loss data to assess the possible impacts climate change
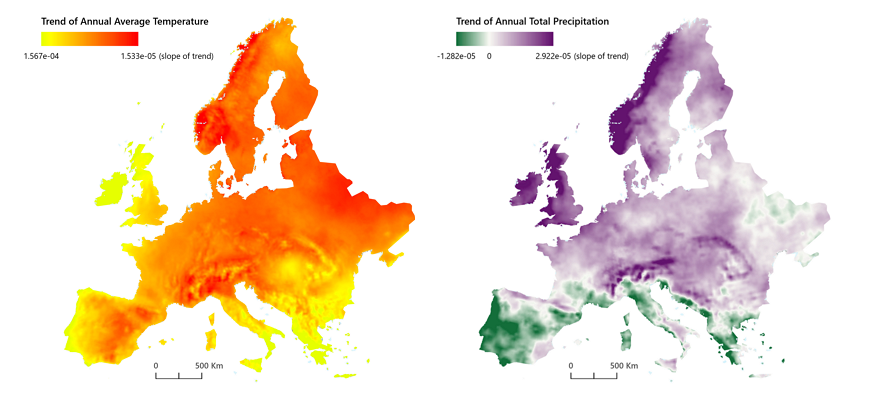
has on beekeeping. The study area is Europe, where the trend raster was calculated and visualized for both annual
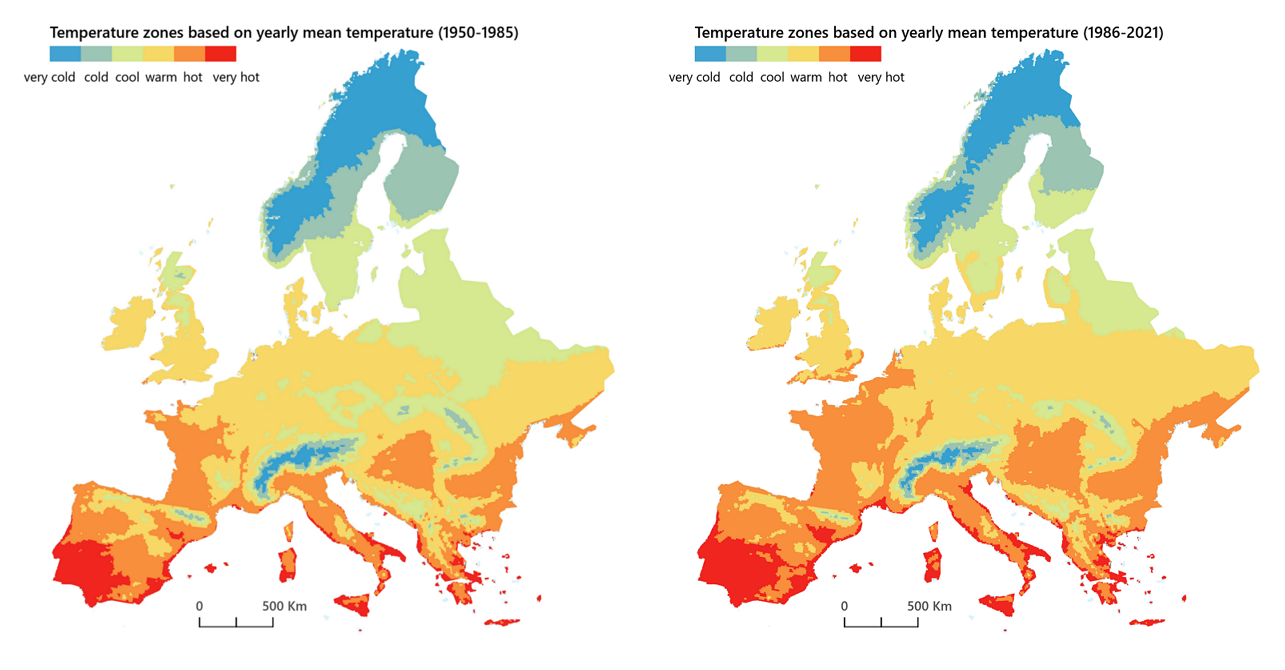
average temperature and annual total precipitation from 1950 to 2021. The results indicated that the whole study area
demonstrated a rising trend of temperature, which provides strong evidence for the warming of climate, whereas the
annual total precipitation didn't show a consistent direction of change in Europe. The statistics for temperature trend
and precipitation trend have also been calculated and summarized for 44 countries cover by the study area as a result
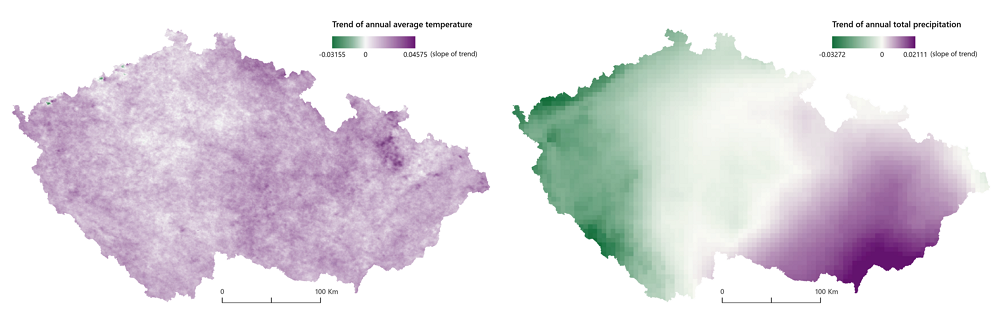
table. Due to the limited availability of bee colony data, the area was limited to the Czech Republic when analyzing the
integration of climate data and bee colony winter losses. Regression analyses were performed to study the relationship
between bee colony winter loss and temperature trend, and between bee colony winter loss and precipitation trend.
Although no statistically significant correlations were found for both of them, the methodologies applied in the
analysis can still produce new inspiration from earth observation in the research on beekeeping with concerns of climate
change. Furthermore, the time profiles were plotted for bee colony winter losses and temperature anomalies calculated
for every year from 2012 to 2020, and similar patterns of fluctuation were discovered from the comparison: the changing
pattern of bee colony winter losses basically followed the evolution of temperature anomalies but with exactly one year
delay, which indicates that high bee colony winter loss can be associated with high temperature anomalies.
In conclusion, this study provided a new perspective for beekeeping support research in the context of likely climate
change, namely the application of earth observation data. The methodologies applied in this thesis can be easily
transplanted to any region of interest, any other observation variables such as NDVI, or even any specific bee species,
to study the influence of the changing earth's surface on bee survival.
Data source
Data source for the web app
Data source for the analysis
Copernicus Climate Change Service: ERA5-Land monthly averaged data from 1950 to present
MOD11: Land Surface Temperature/Emissivity Daily L3 Global 1km
TerraClimate: Global, high-resolution gridded temperature, precipitation, and other water balance variables
Beekeeping data
Bee colony winter loss: Crowdsourced data from beekeepers in the Czech Republic (from the COLOSS survey)
Elements
Text
This is bold and this is strong. This is italic and this is emphasized.
This is superscript text and this is subscript text.
This is underlined and this is code: for (;;) { ... }. Finally, this is a link.
Heading Level 2
Heading Level 3
Heading Level 4
Heading Level 5
Heading Level 6
Blockquote
Fringilla nisl. Donec accumsan interdum nisi, quis tincidunt felis sagittis eget tempus euismod. Vestibulum ante ipsum primis in faucibus vestibulum. Blandit adipiscing eu felis iaculis volutpat ac adipiscing accumsan faucibus. Vestibulum ante ipsum primis in faucibus lorem ipsum dolor sit amet nullam adipiscing eu felis.
Preformatted
i = 0;
										while (!deck.isInOrder()) {
											print 'Iteration ' + i;
											deck.shuffle();
											i++;
										}

										print 'It took ' + i + ' iterations to sort the deck.';
Lists
Unordered
- Dolor pulvinar etiam.
- Sagittis adipiscing.
- Felis enim feugiat.
Alternate
- Dolor pulvinar etiam.
- Sagittis adipiscing.
- Felis enim feugiat.
Ordered
- Dolor pulvinar etiam.
- Etiam vel felis viverra.
- Felis enim feugiat.
- Dolor pulvinar etiam.
- Etiam vel felis lorem.
- Felis enim et feugiat.
Icons
Actions
Table
Default
| Name |
Description |
Price |
| Item One |
Ante turpis integer aliquet porttitor. |
29.99 |
| Item Two |
Vis ac commodo adipiscing arcu aliquet. |
19.99 |
| Item Three |
Morbi faucibus arcu accumsan lorem. |
29.99 |
| Item Four |
Vitae integer tempus condimentum. |
19.99 |
| Item Five |
Ante turpis integer aliquet porttitor. |
29.99 |
|
100.00 |
Alternate
| Name |
Description |
Price |
| Item One |
Ante turpis integer aliquet porttitor. |
29.99 |
| Item Two |
Vis ac commodo adipiscing arcu aliquet. |
19.99 |
| Item Three |
Morbi faucibus arcu accumsan lorem. |
29.99 |
| Item Four |
Vitae integer tempus condimentum. |
19.99 |
| Item Five |
Ante turpis integer aliquet porttitor. |
29.99 |
|
100.00 |