Introduction
Landslides are a common hazard in many parts of the world and can result in significant damages on infrastructure and losses of life, landscape changes, reduction in agricultural activities, and huge economic losses. They can be triggered by natural factors such as intense rainfalls and earthquakes, as well as human activities such as deforestation and construction. They occur in different scales, from a major landslide to regional events with thousands of landslides. In addition, the landslide classification modified by Hungr et al. (2014) presents 32 landslide types, highlights the complexity of these natural phenomena. With climate change and population growth, the frequency of landslides and the number of people affected by them are increasing. New Zealand is one of the countries that is highly prone to landslides due to its geological features and location. Mountainous terrain with steep slopes, together with intense rainfall patterns and tectonic activities, result in highly susceptible areas to landslide failures in New Zealand. The main damages from landslides in this country include road closure, soil degradation, pasture productivity losses, river sedimentation, and loss of water quality (Rosser et al., 2017). The damages and complexity of the landslides trigger advanced image analysis methods for landslide mapping and monitoring the activation and evolution of landslides over time.
For several decades, visual interpretation of aerial imagery combined with field surveying have been considered as the common procedures in landslide mapping around the world, in which the expert manually delineates the landslide; however, this procedure is time-consuming, resource-intensive, and timely unavailable (Martha et al., 2010). In the recent years, Earth Observation (EO) data from different high resolution (HR), very high resolution (VHR) optical and synthetic aperture radar (SAR) sensors have facilitated the rise of new approaches to investigate the landslides. The availability and open-source feature of EO satellites programs such as Copernicus Sentinel missions have paved the way to new emerging cost-effective methodologies. The European Union's Earth Observation Programme, Copernicus, which provides multispectral high-resolution data with 13 spectral bands and different spatial resolutions (up to 10 m for Red, Green, Blue (RGB) and Near-infrared (NIR) bands) with the repeat cycle of five days ( Drusch et al., 2012). Sentinel-2 with 10 m resolution and high revisit time provides a rich resource of optical data for monitoring landslides. Despite the abundancy of EO data, providing a common methodology for recognising and monitoring landslide failures is yet challenging. Landslides lack distinguishable and identical spectral, spatial and temporal characteristics and the texture feature of the landslides can vary, influenced by geomorphological and hydrological factors besides weather conditions Zhong et al., 2020). This diploma thesis aims to assess the efficiency of Object-based Image Analysis methodology to semi-automatically map the major landslide, the case study of Kaiwhata landslide, and monitor its evolution and the following risks that were accompanied by, using Sentinel-2 and PlanetScope satellite images between 2017 and 2021.
Methodology
Study Area
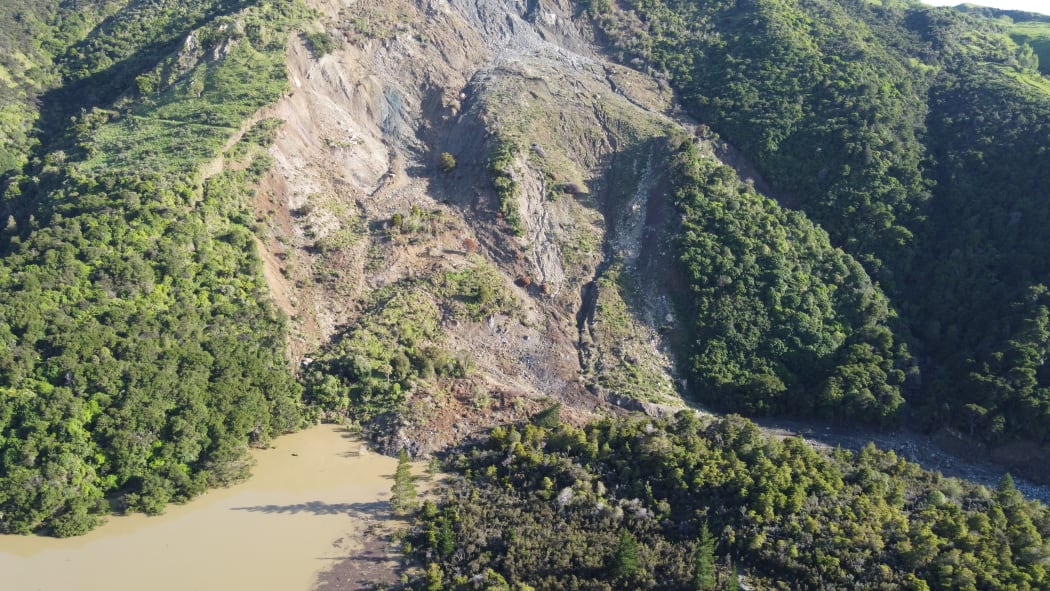
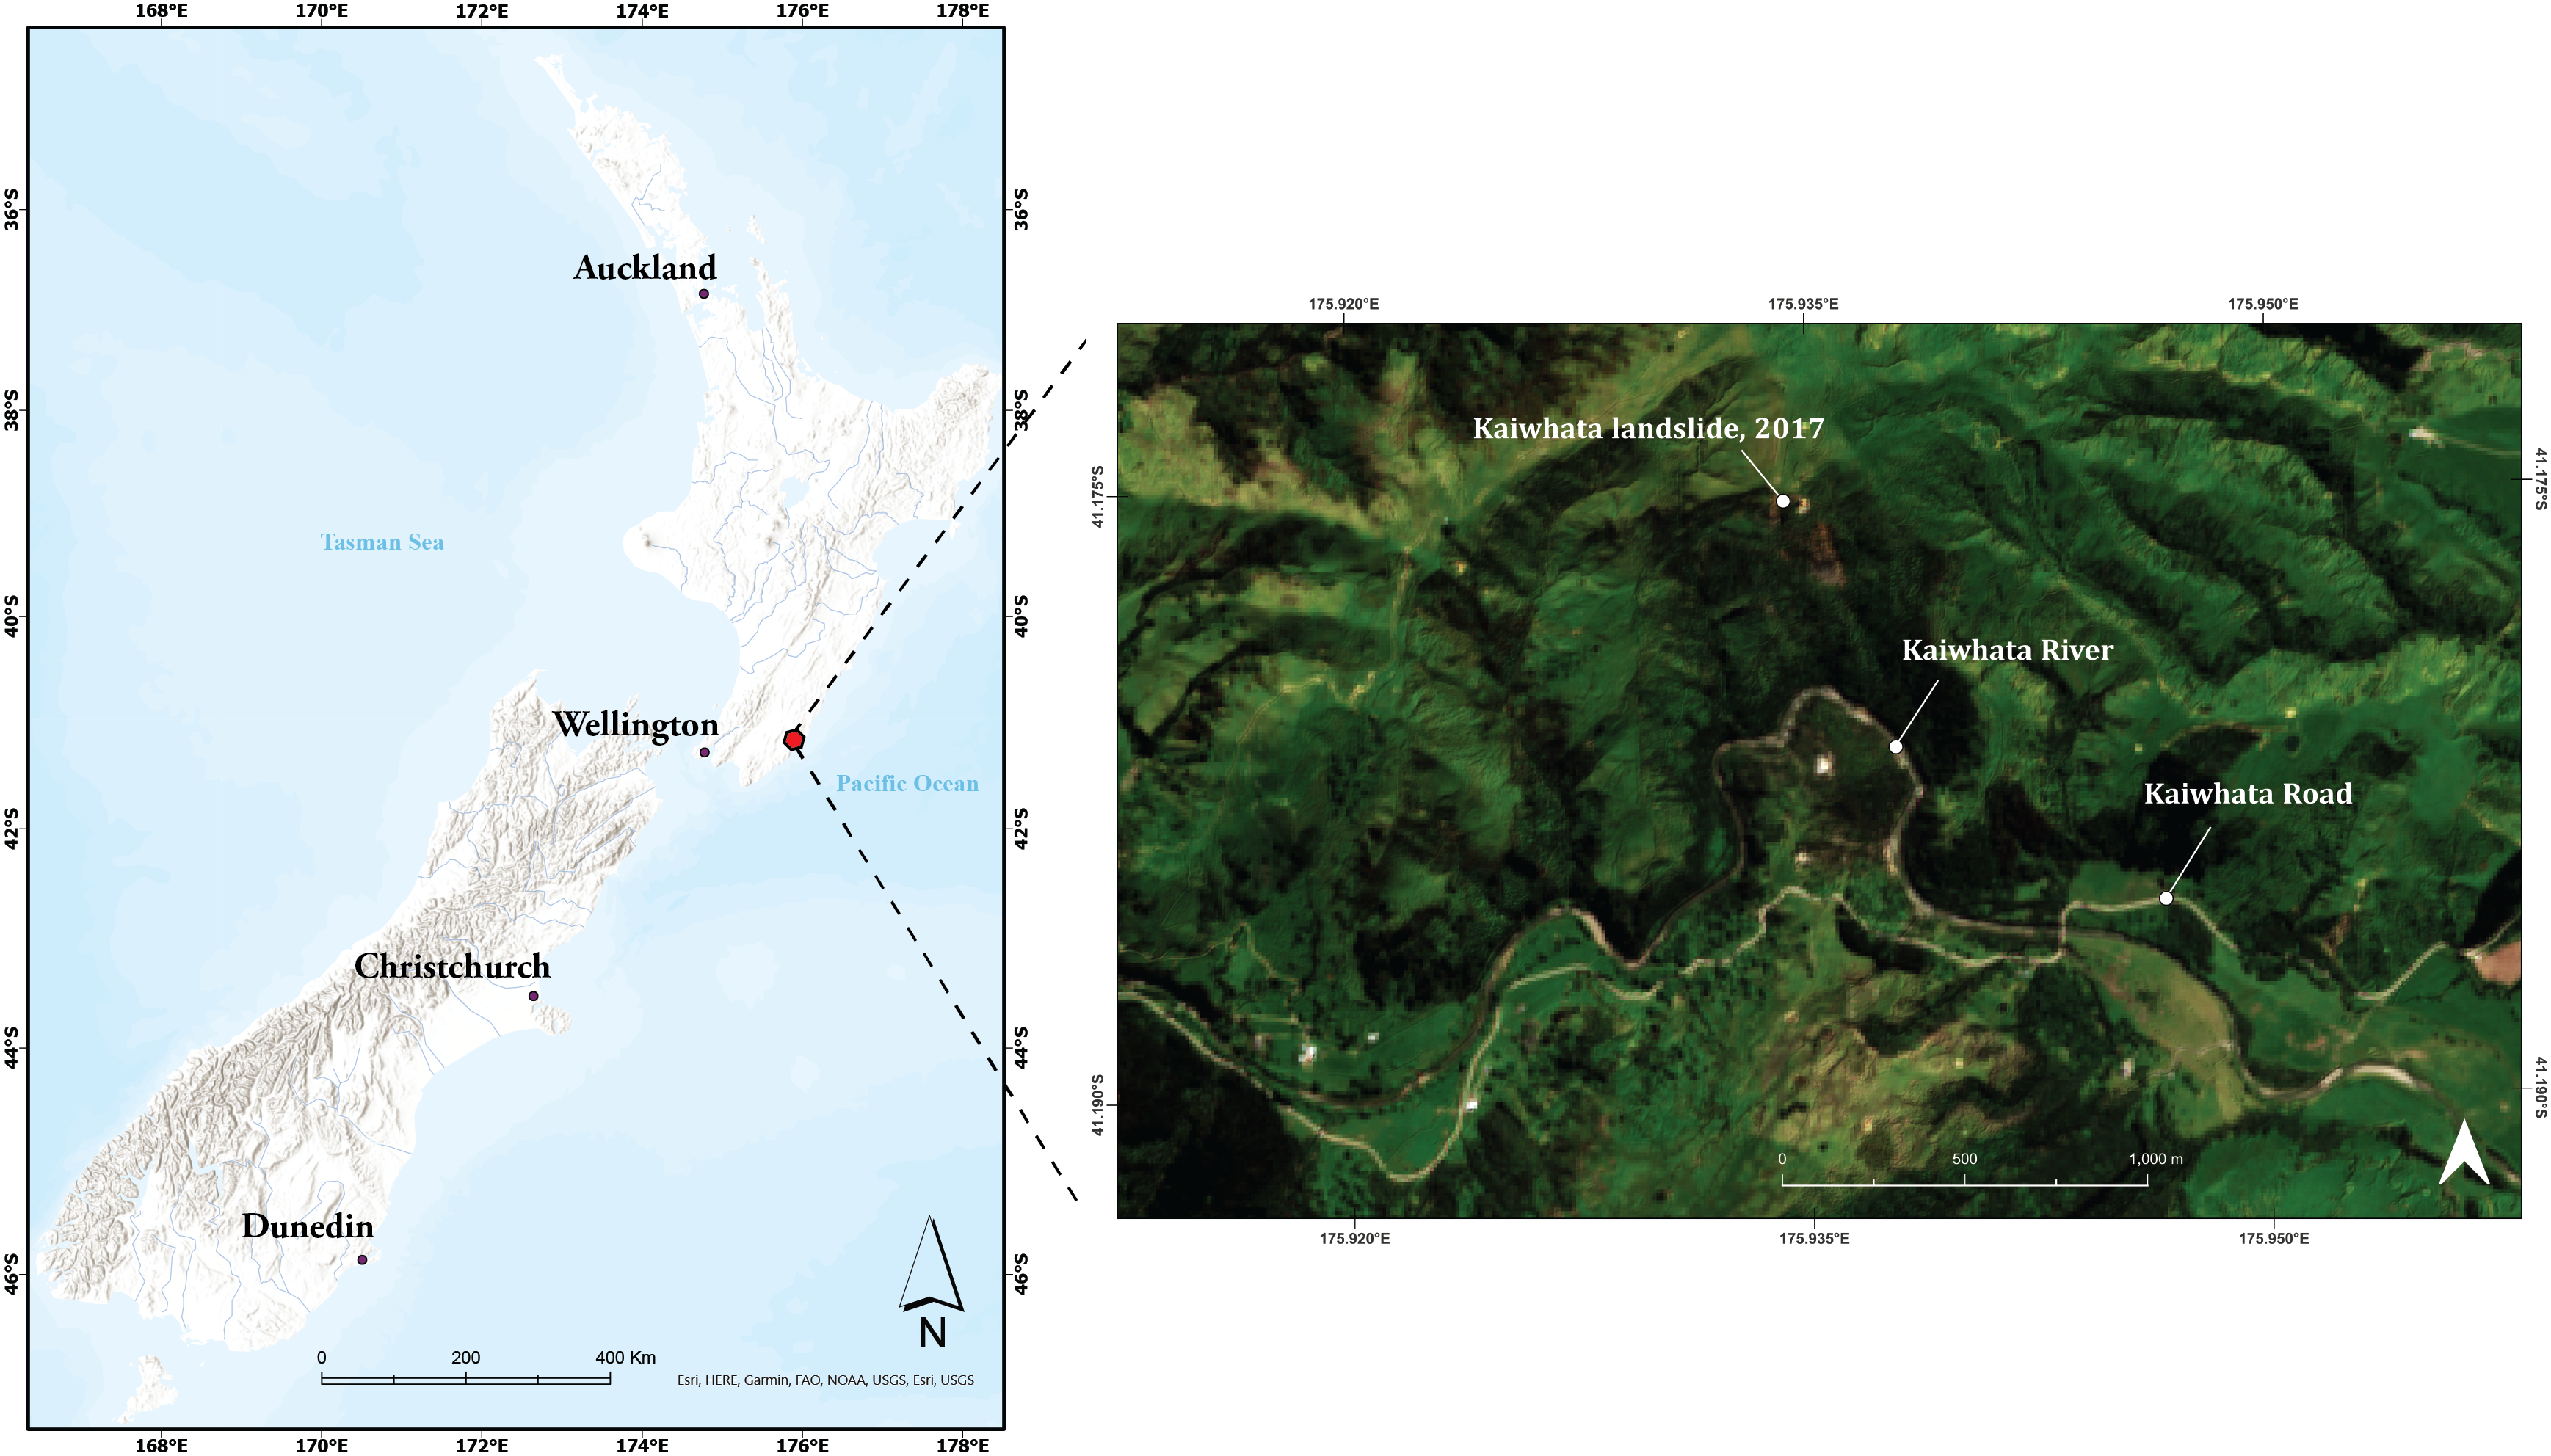
The study area is located in the south of New Zealand's North Island, within the Wairarapa geographical region, east of Wellington. The area covers 9.7 squared kilometer and is characterised by the Kaiwhata River, which flows to the southeast reaching the Pacific Ocean. The topography of the study selected area varies from 10 m to 500 m a.s.l. It and is mainly covered by grassland and forest areas and accessed through the Kaiwhata road.
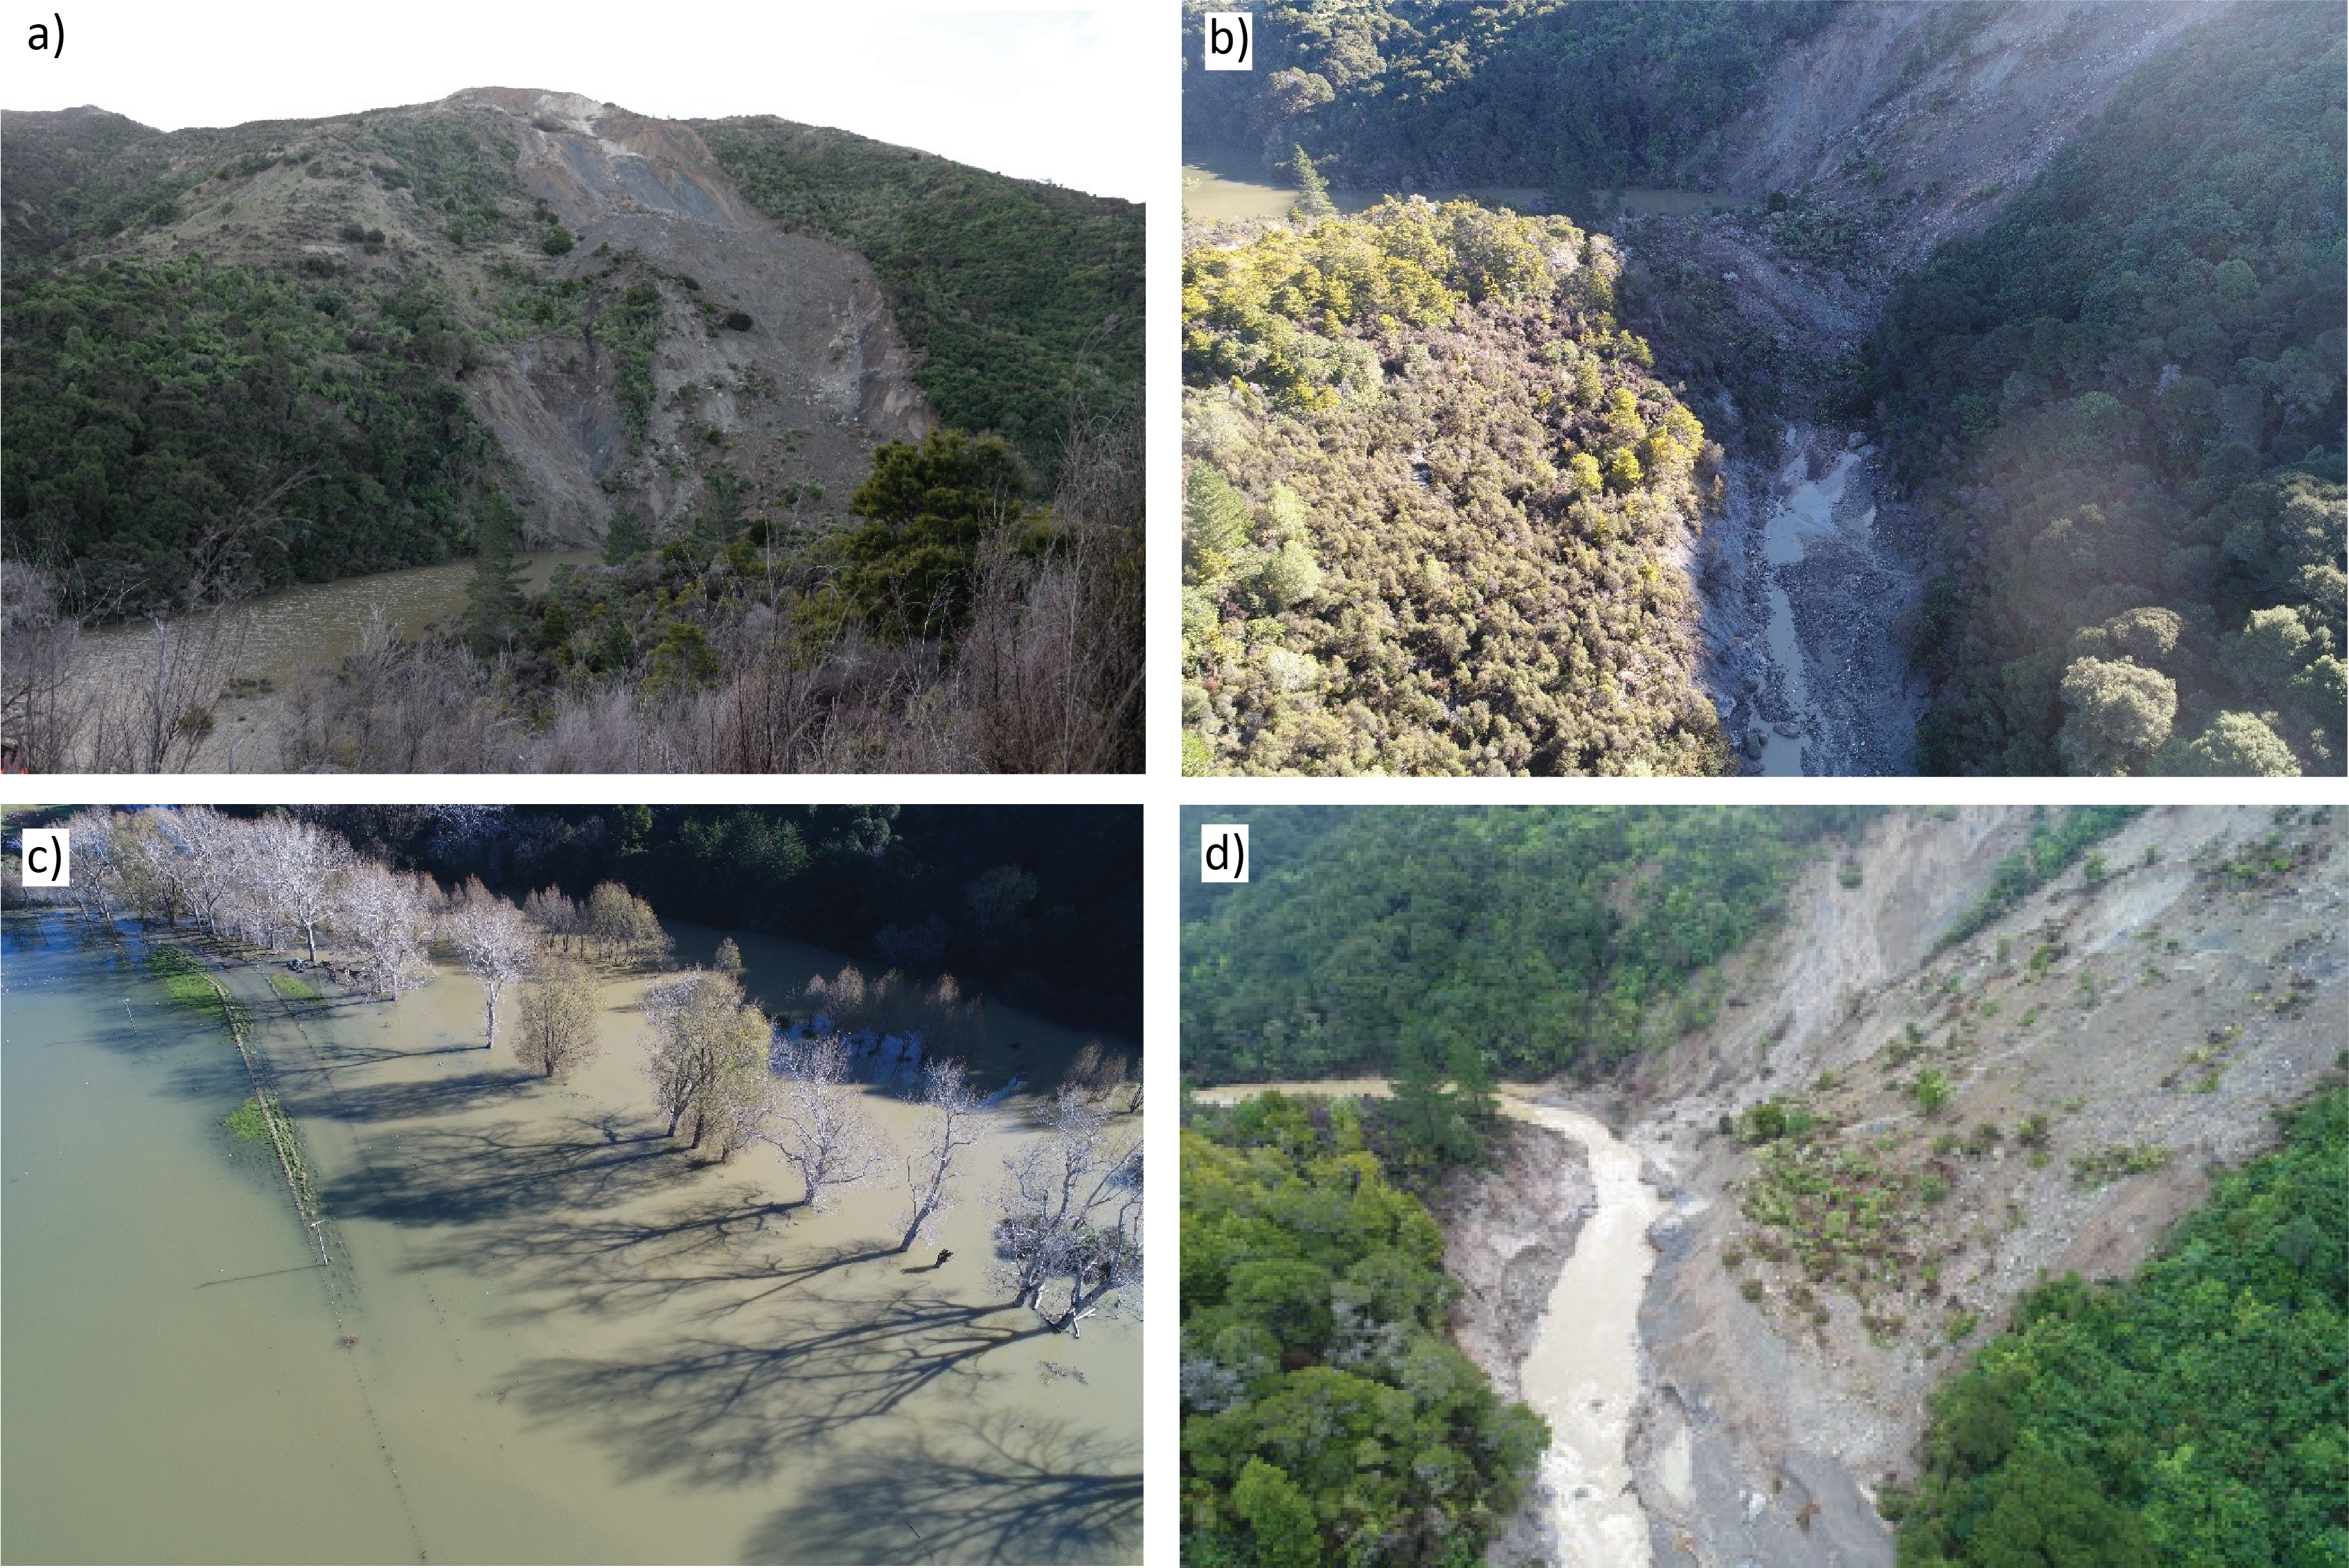
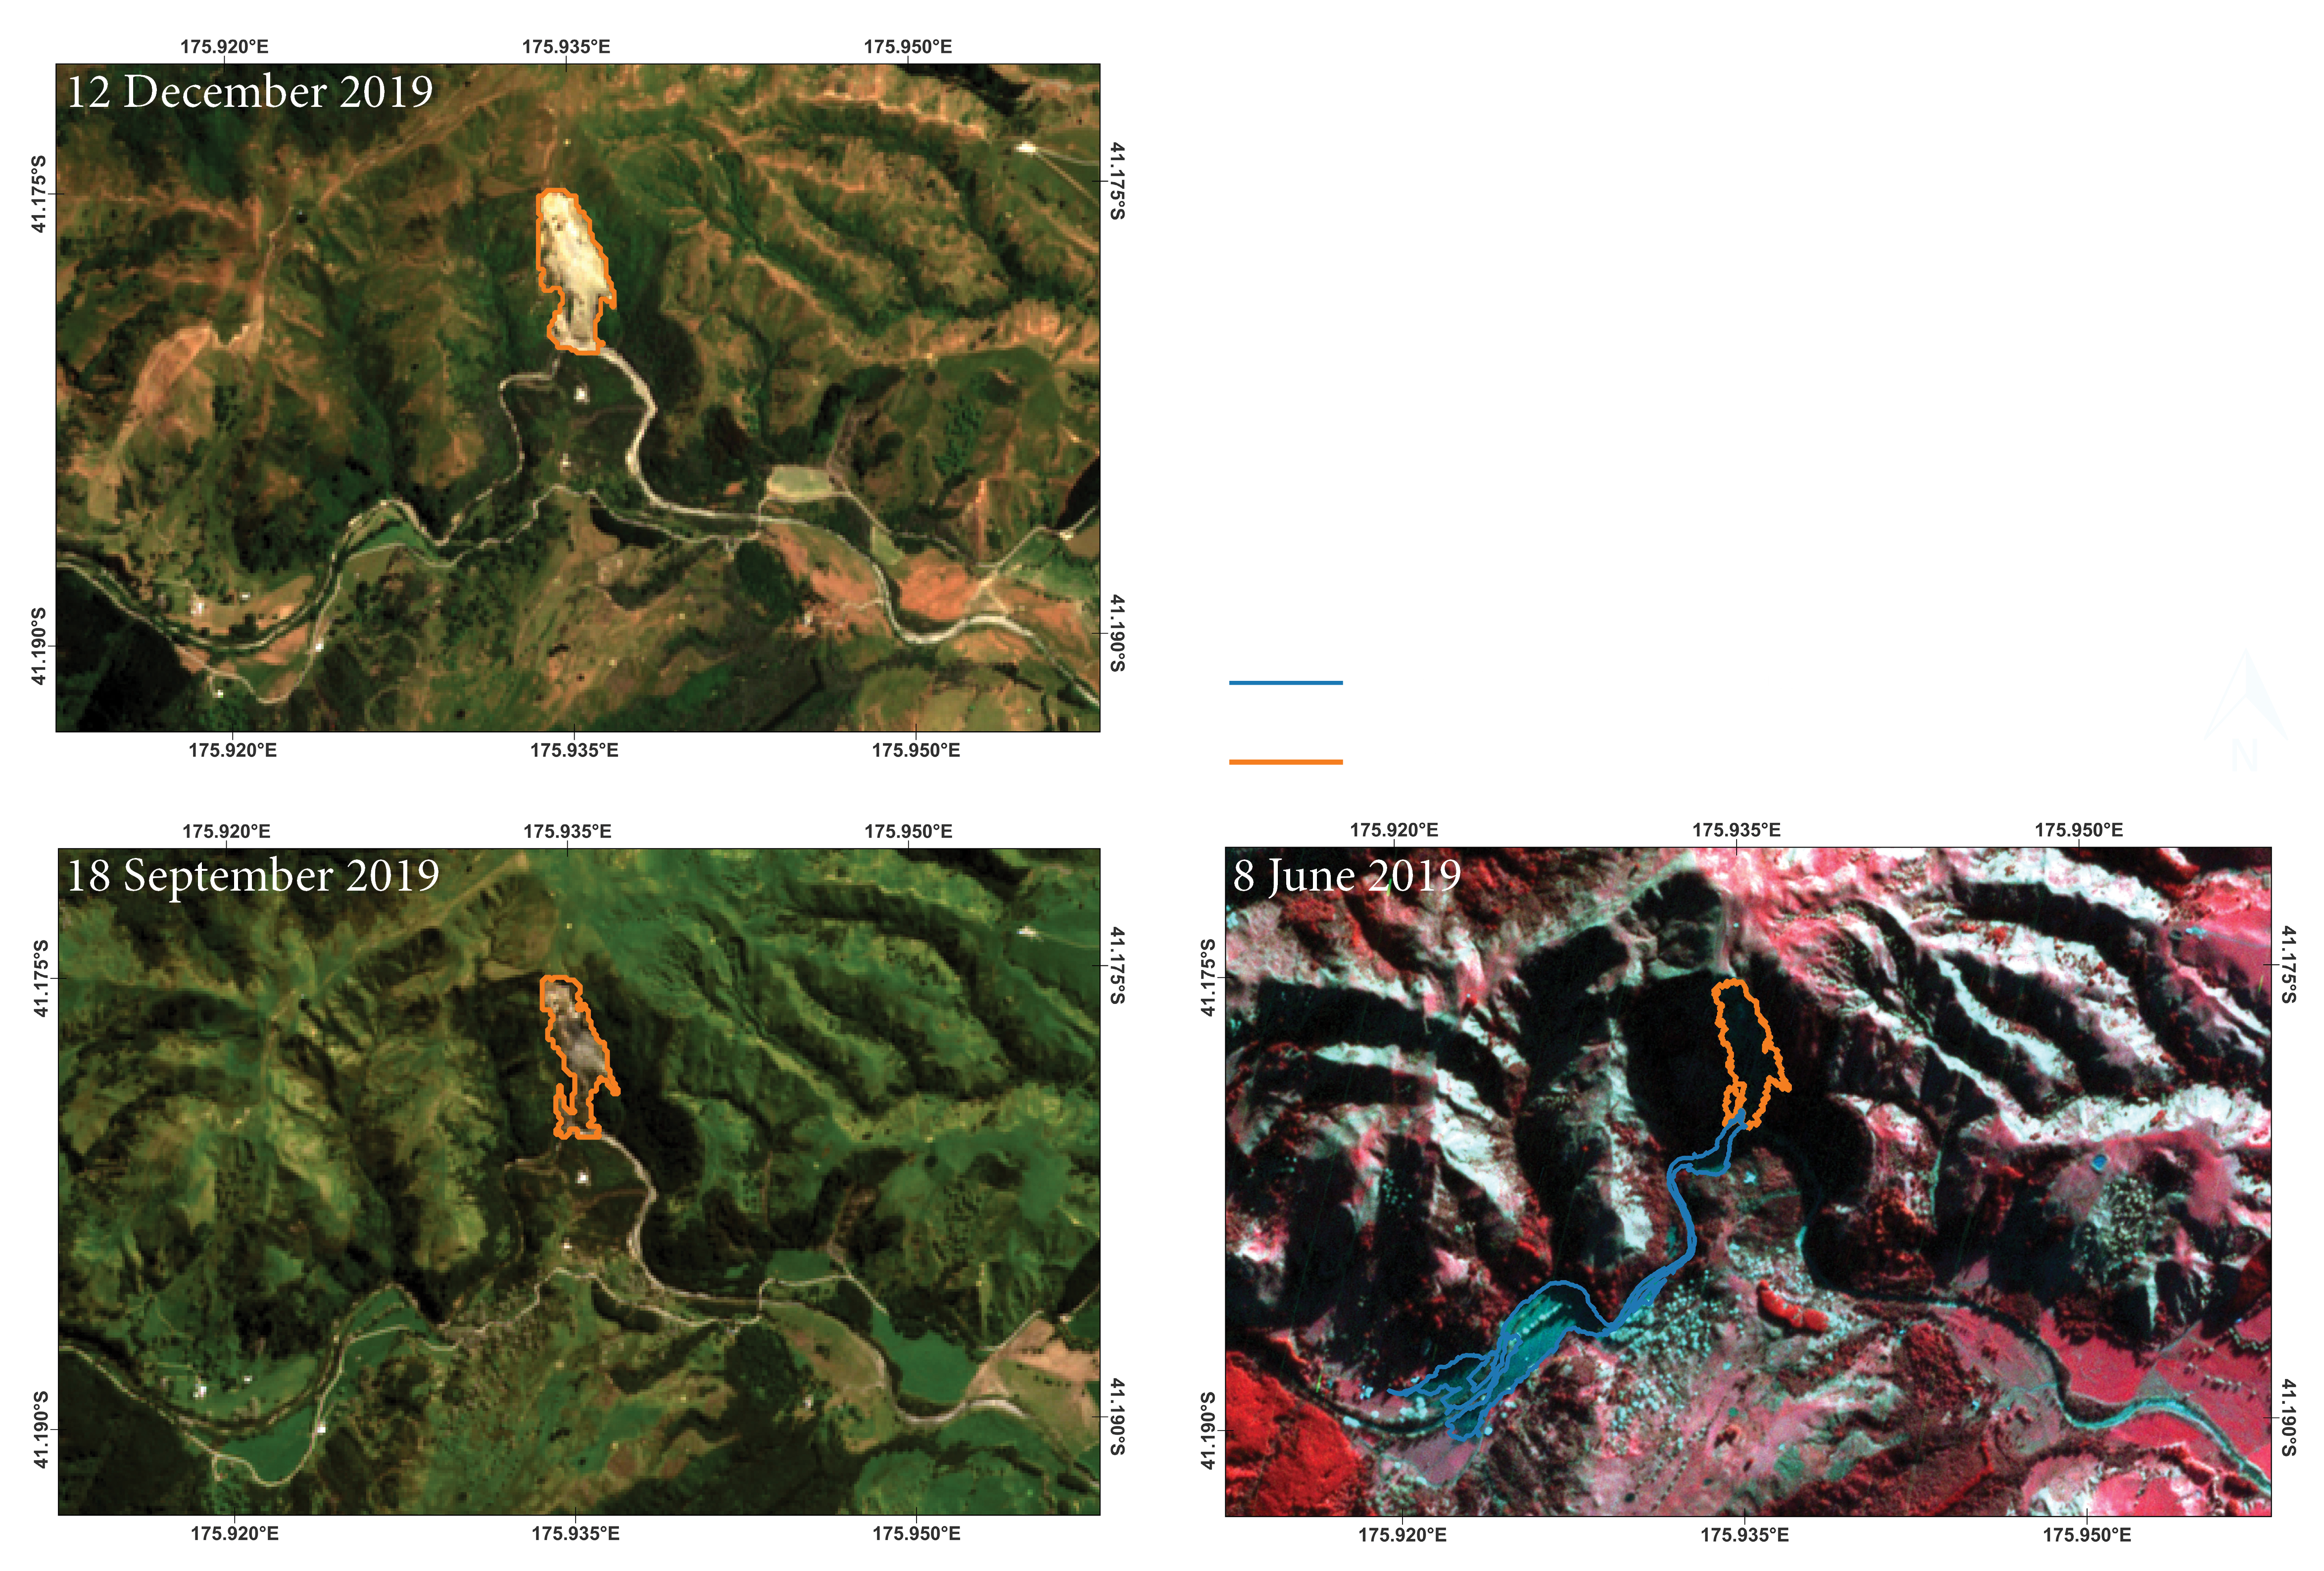
The initial landslide failure that occurred in 2017 was comparatively small. The second landslide failure on 1 June 2019 near the Kaiwhata River (a) was significantly larger. The debris set up a landslide dam (b), which lasted approximately two weeks, formed an extensive upstream lake (c), and closed the Kaiwhata road. Due to the uprising level of the lake (overtopping), the formation of a minor water channel towards downstream, and the material specifications, the dam failed and released around 1.1 M cubic meter of water in less than two hours to the downstream area (d).
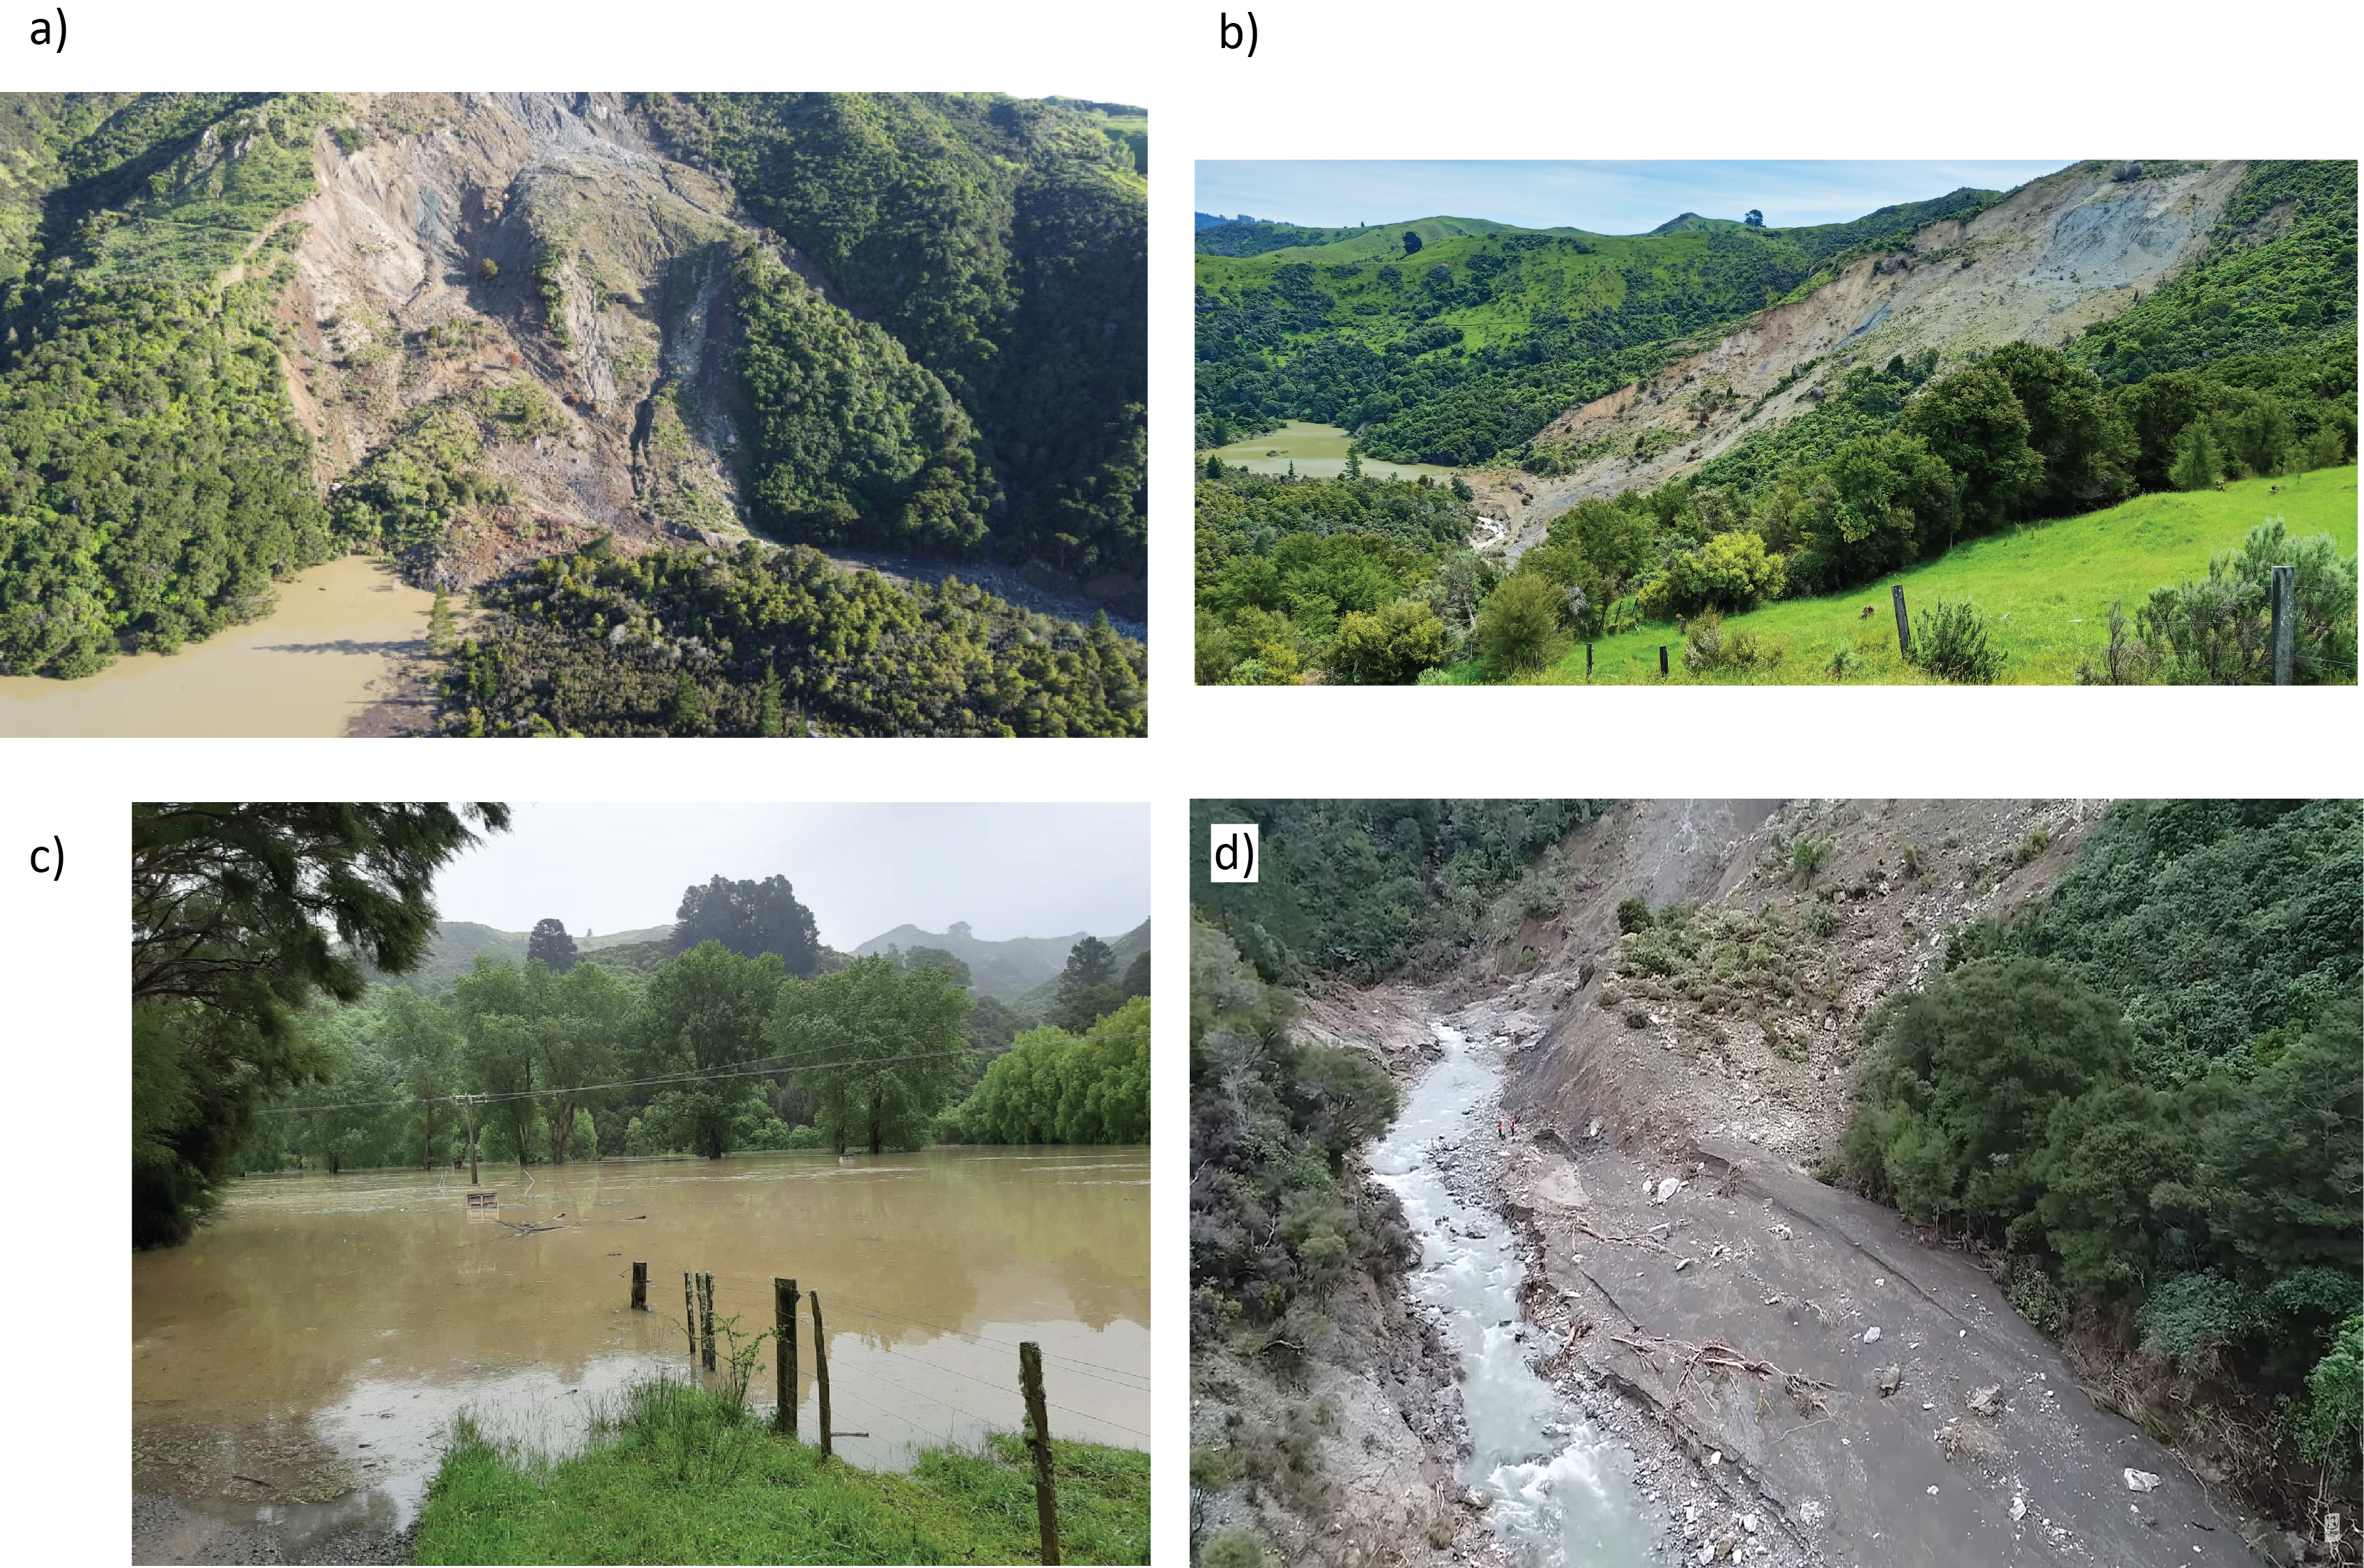
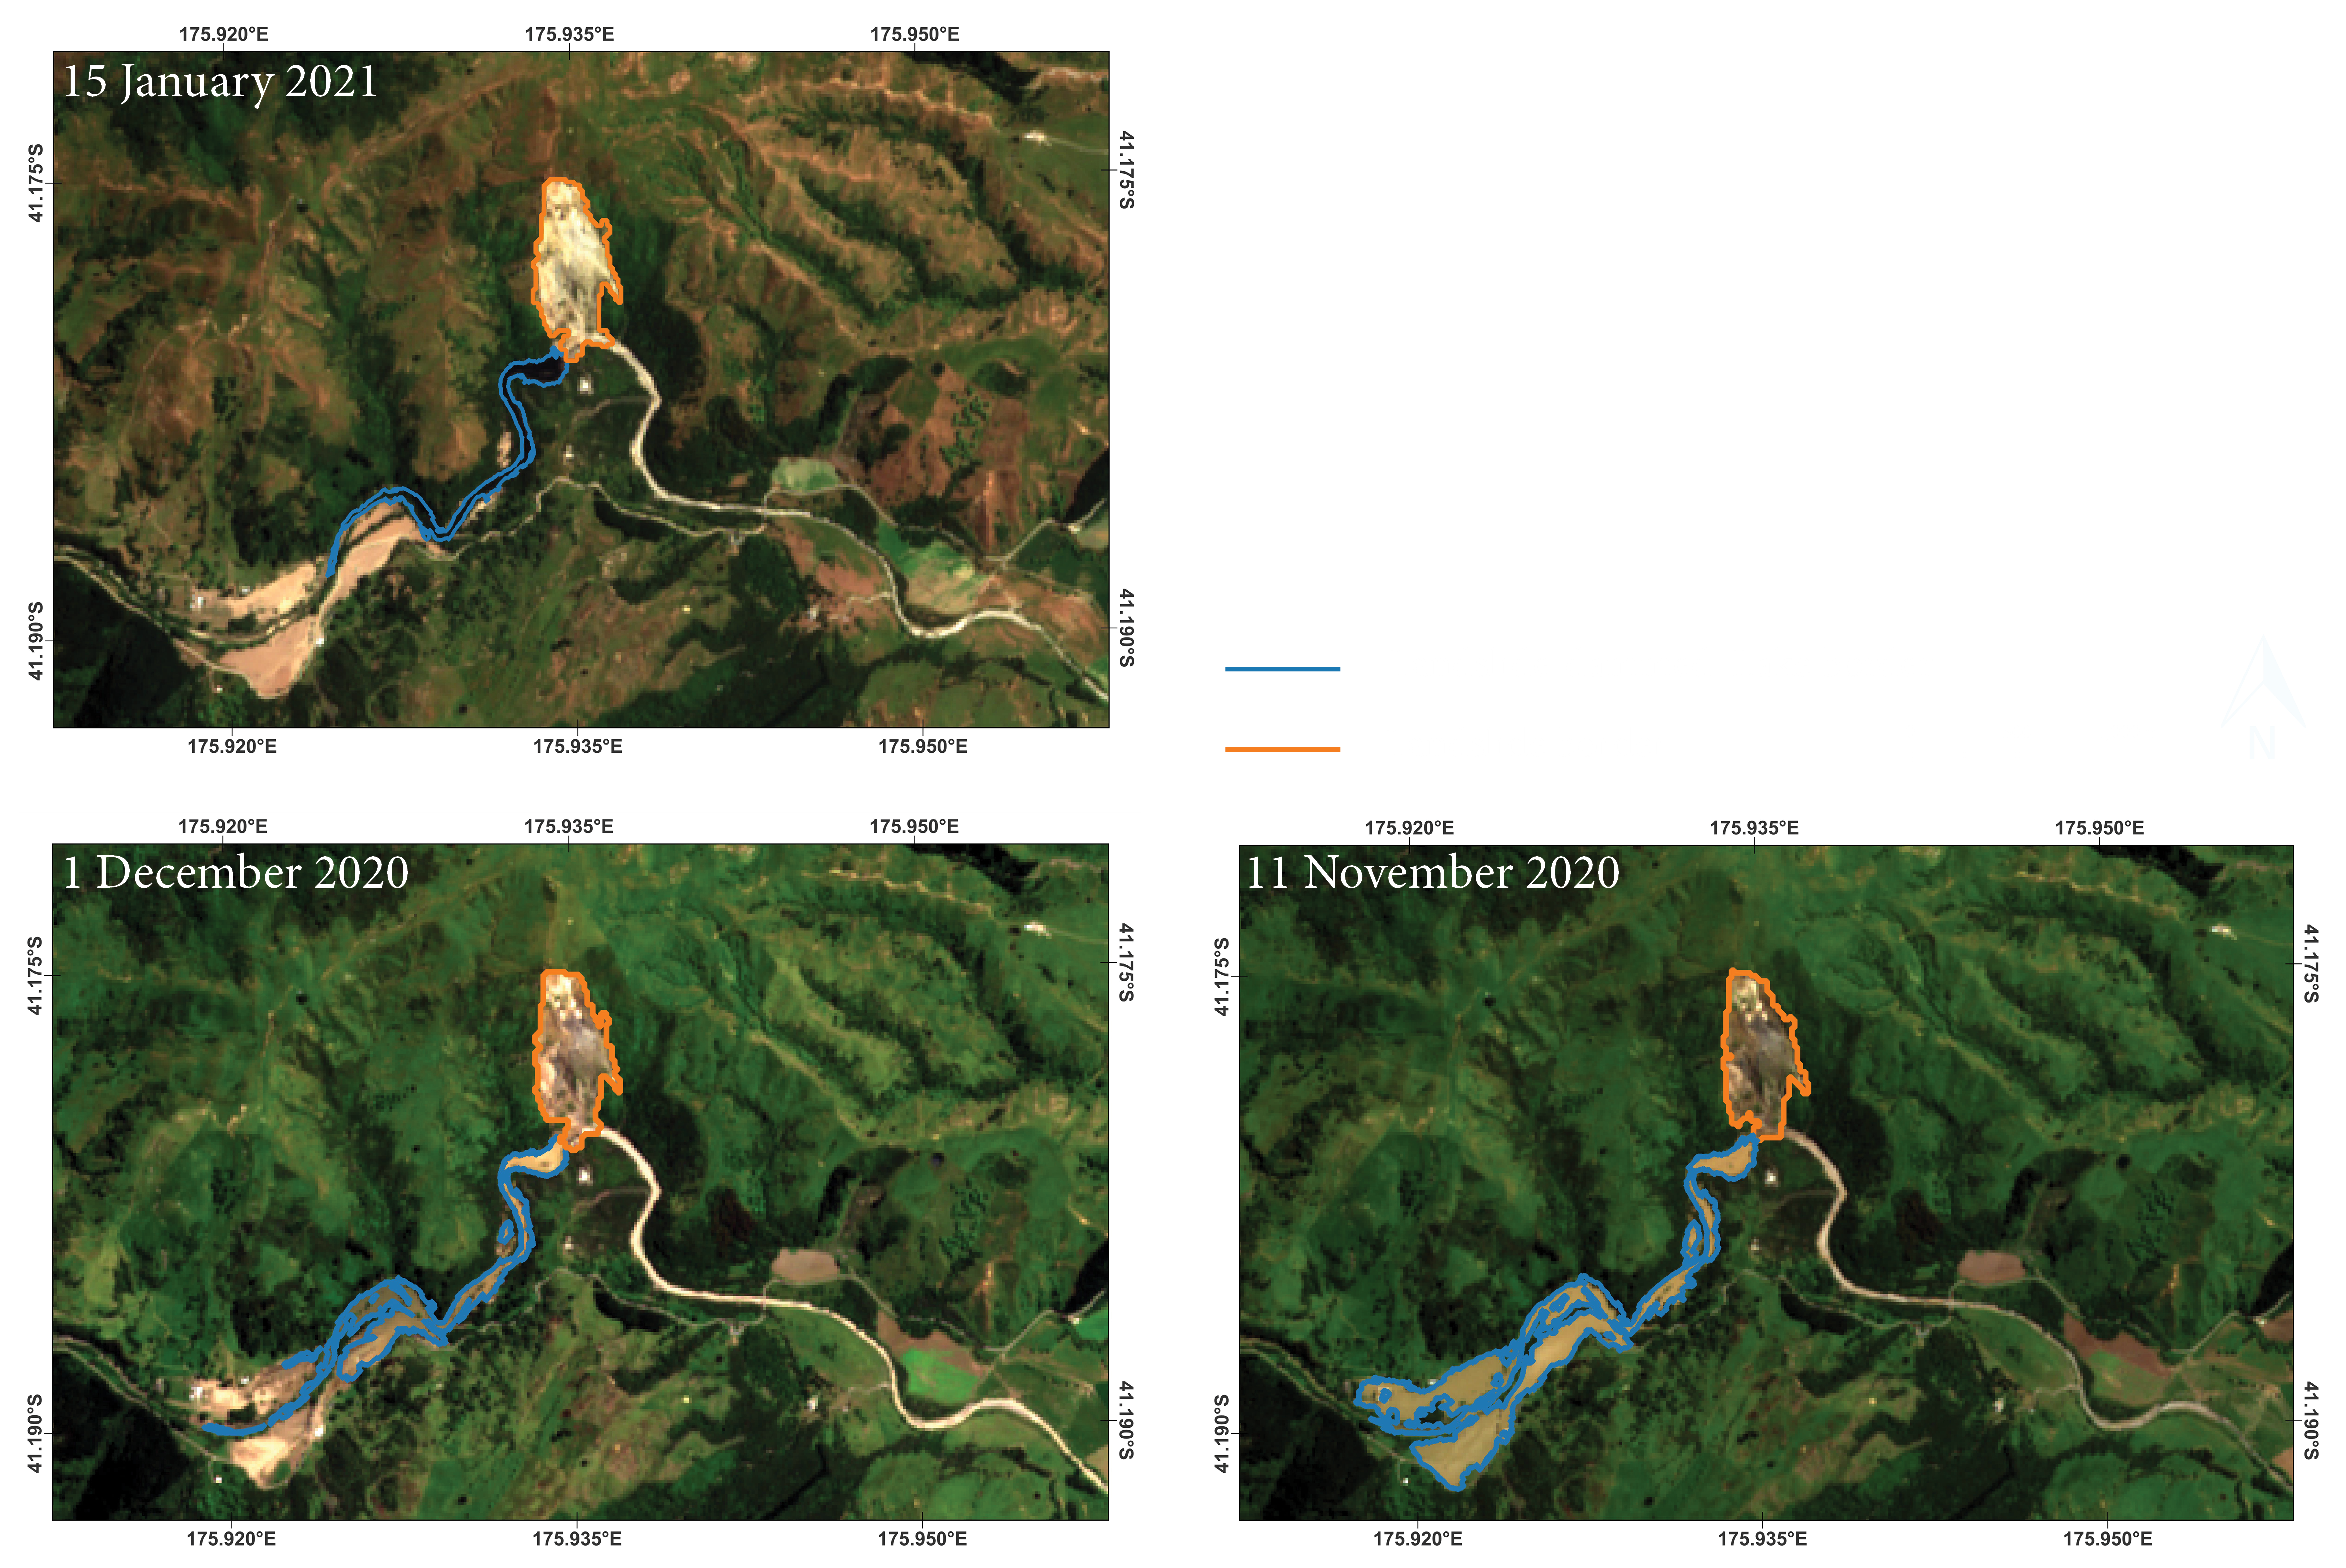
This cycle of incidents occurred again from November 2020 to January 2021. The landslide was reactivated after heavy rainfall in November 2020 (a) and formed an upstream lake (b). The formed lake damaged adjacent properties, lands, the main road, and infrastructure (c) and after several weeks, the landslide-dammed lake overtopped the dam, and the dam failed (d).
Workflow
The procedure started from the data acquisition through Copernicus Open Access Hub for Sentinel-2 images, Planet Explorer for PlanetScope image, and LINZ Data Service for Digital Elevation Model (DEM) and filter the images based on cloud coverage and their availability in a desired date. Applying image analysis based on Object-based Image Analysis (OBIA) to modify a single workflow for delineating landslide failures and landslide-dammed lakes, the results were followed up by an accuracy assessment to compare the OBIA mapped outputs with manual mapping. The visualization of the results in 2D and 3D were provided to reflect the changes and the evolution of failures into static and interactive ways.
Analysis
The advances in landslide analysis and mapping in OBIA stem from the multi-scale object-based integration of spectral information (colour), spatial properties (e.g., size, shape), textural data (e.g., surface disturbance difference), and contextual information (e.g., relationship with neighbouring objects) (Blaschke et al., 2014) that, together with other datasets, such as a Digital Elevation Model (DEM) and its derivatives, have provided promising results (Holbling et al.,2017, 2020; Martha et al., 2016; Blaschke et al., 2014; Amatya et al., 2021; Karantanellis et al., 2020).
The following figure shows the overall framework of landslide and landslide-dammed lake classification. The ruleset follows several steps to assign the desired classes. Each step consist of multiresolution segmentation, set of classification parameters, and class refinement. Meanwhile, this overall workflow was not applied to all the images, where the evolution of the landslide failure was accompanied by more sets of parameters and refinements. The values dedicated to some layers such as NDVI, DEM, and aspect were varied (VARIES) due to seasonal changes and morphological evolution of the landslide. Step 2 helped to distinguish the deposition zone of the landslide from the riverbed to complete the extent of the landslide. The difficulty stemmed from the texture similarity between them and applying multiresolution segmentation on the unclassified objects from Step 1 helped to identify the remained landslide area effectively. DEM and slope were effective layers for segmentation in Step 3 and NDWI, NDVI, and NIR indices were applied to extract landslide-dammed lake. Spatial features (e.g., relations to neighbour objects) had key role in the classification refinement besides spectral indices.
Result
OBIA Landslide and Landslide-dammed Lake Mapping
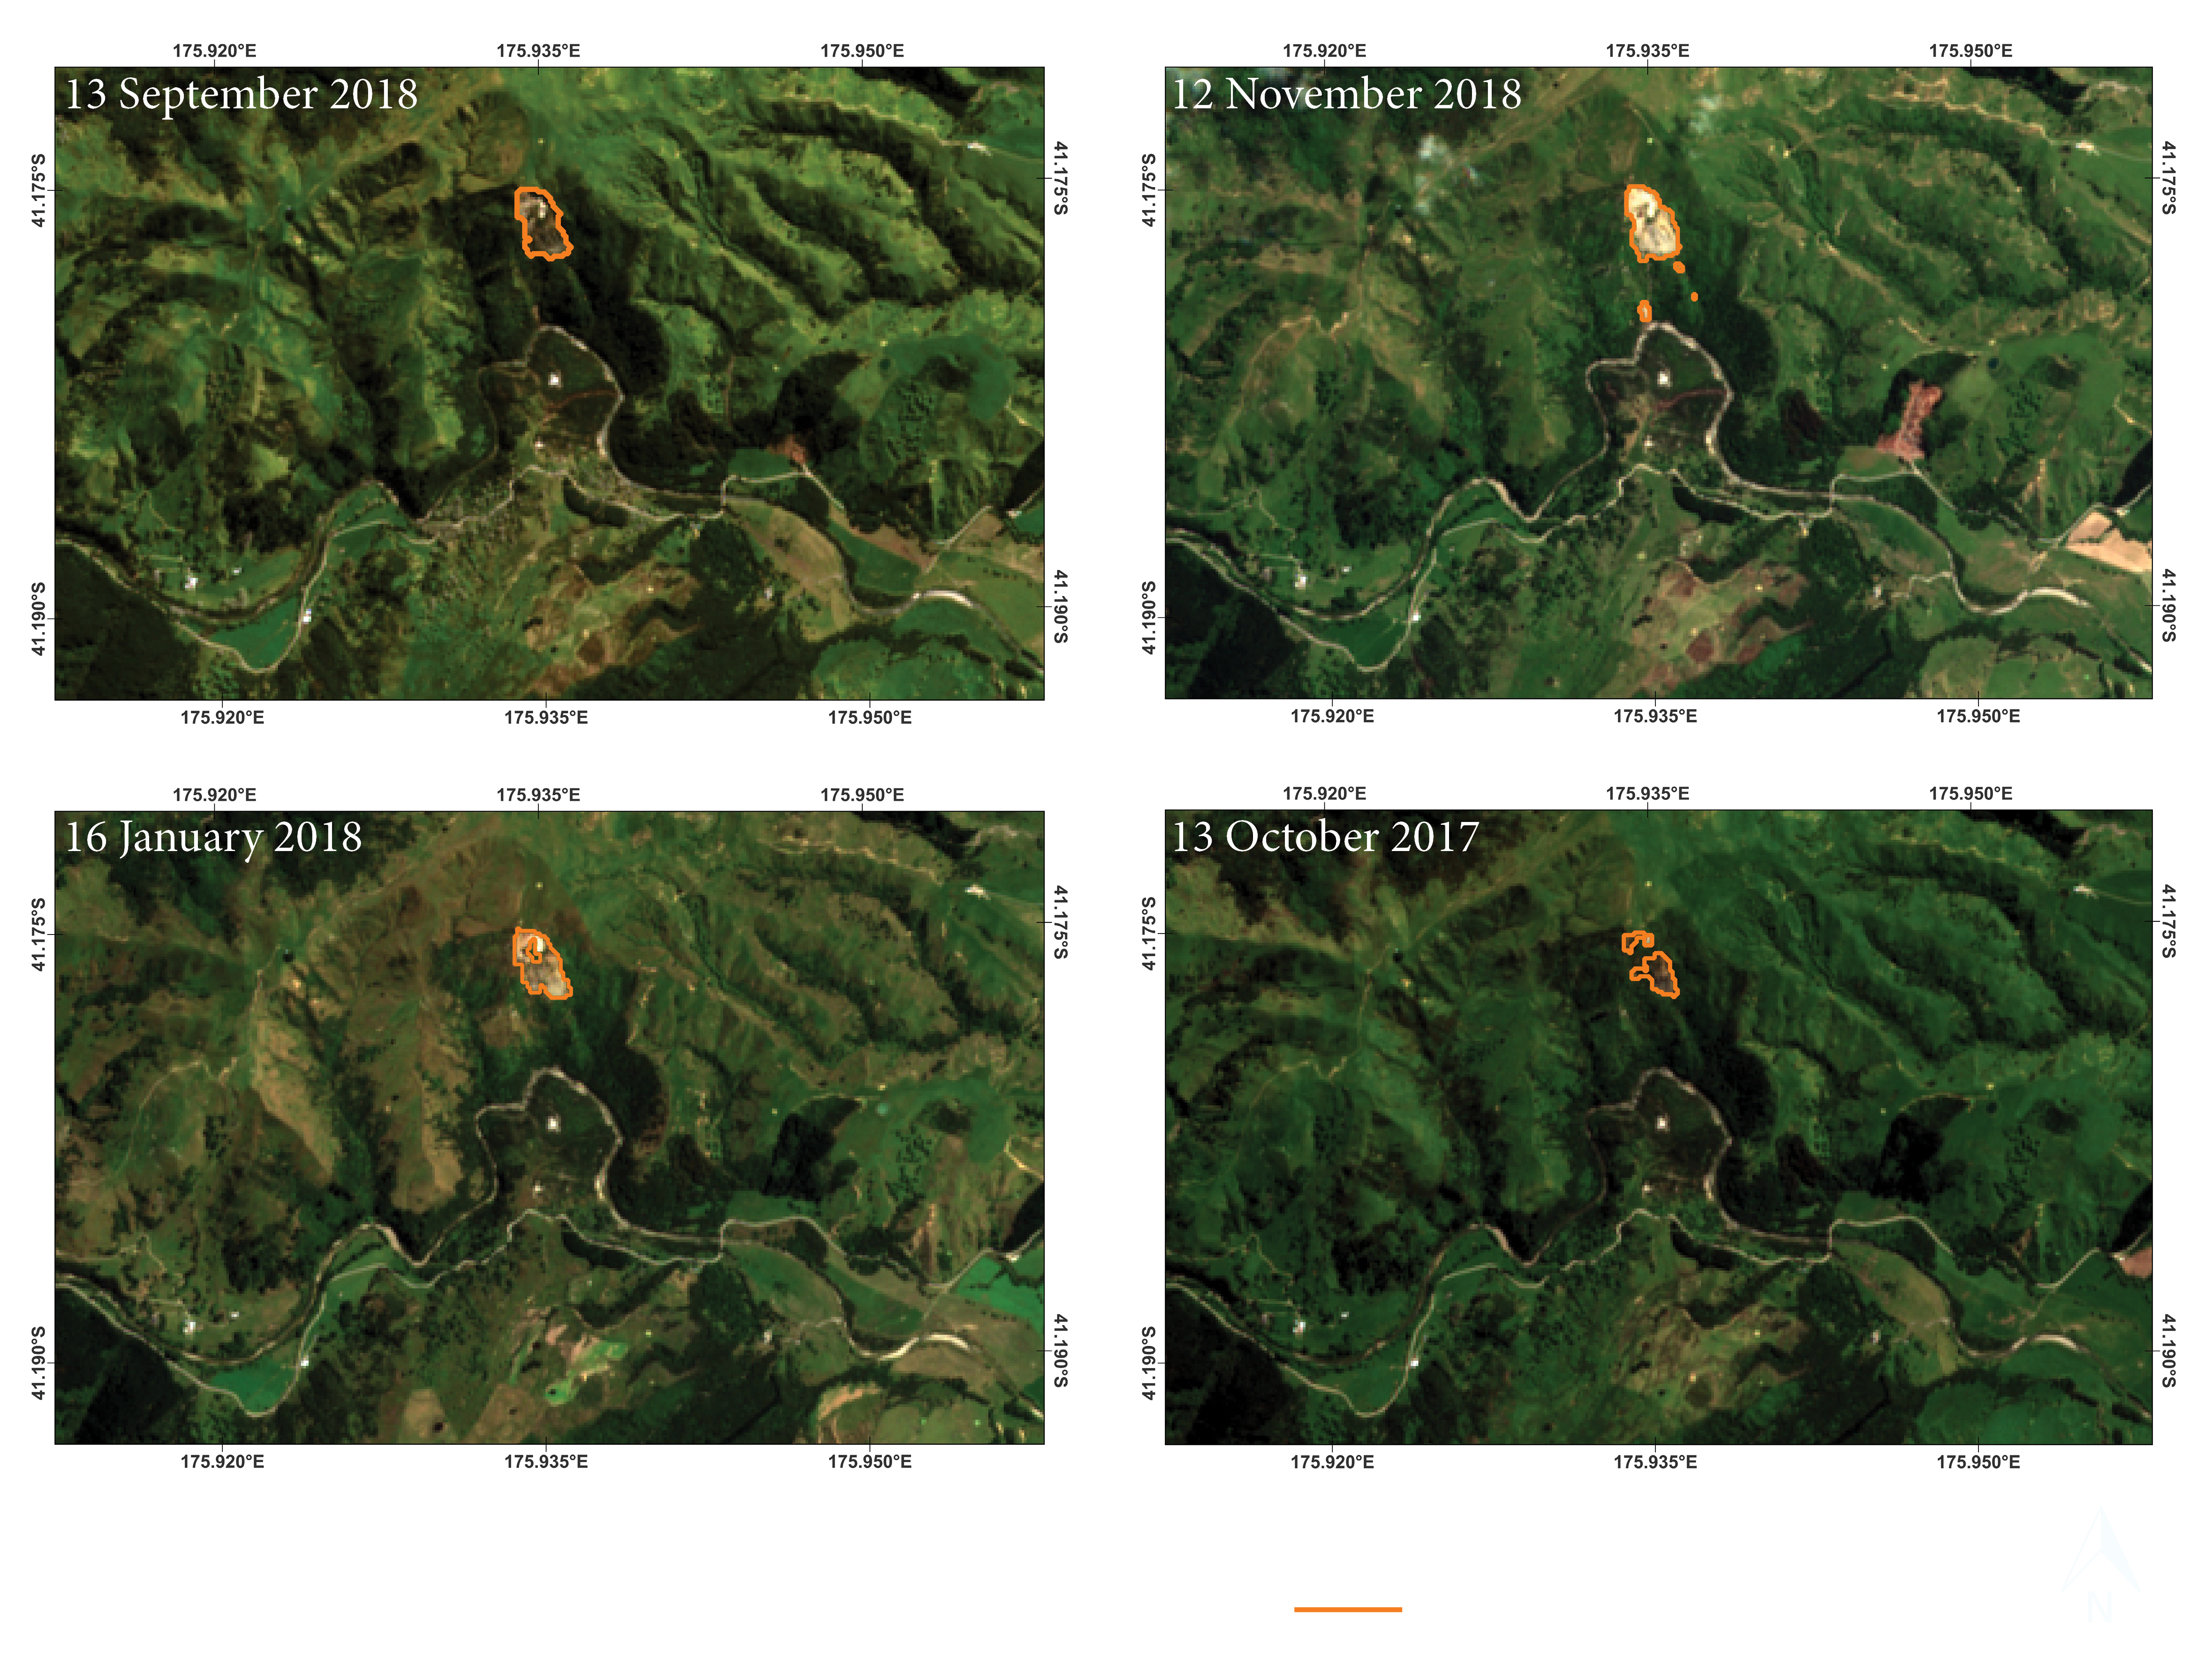
The results from 2017 and 2018 reflect slight changes in the extent of the landslide. The changes show how the landslide was evolving continuously. The landslide was activated in two separate but adjacent areas. Over time, the parts evolved and the vegetation between them disappeared. The result from 16 January 2018 shows that the two separate landslide failures reached each other, however, vegetation between the adjacent parts still existed, and it was concluded to exclude it from the landslide. The vegetated area diminished in the image from 13 September 2018 and the landslide became relatively unmixed. The topographic features of the area and the precipitation formed two water streams from the upper part and caused erosion and incision, resulting in new small slope failures that are visible in the image from 12 November 2018. The erosion continued over time and destabilised the entire slope, likely leading to the second landslide failure.
The second failure of the landslide in summer 2019 was triggered by intense rainfall. The separate slight landslides became a major landslide and formed a landslide-dammed lake since the debris flow reached the Kaiwhata riverbed and blocked the stream, the dam failed after two weeks. The landslide continued to evolve gradually; however, significant changes occurred in November 2020.
Due to the intense rainfall in November 2020 (GNS Science, 2021), the landslide area was extended, and large amount of debris flow blocked the river. As the result, larger lake formed by the intense rainfall that remained for more than six weeks until the lake overtopped the dam and joined the downstream completely.
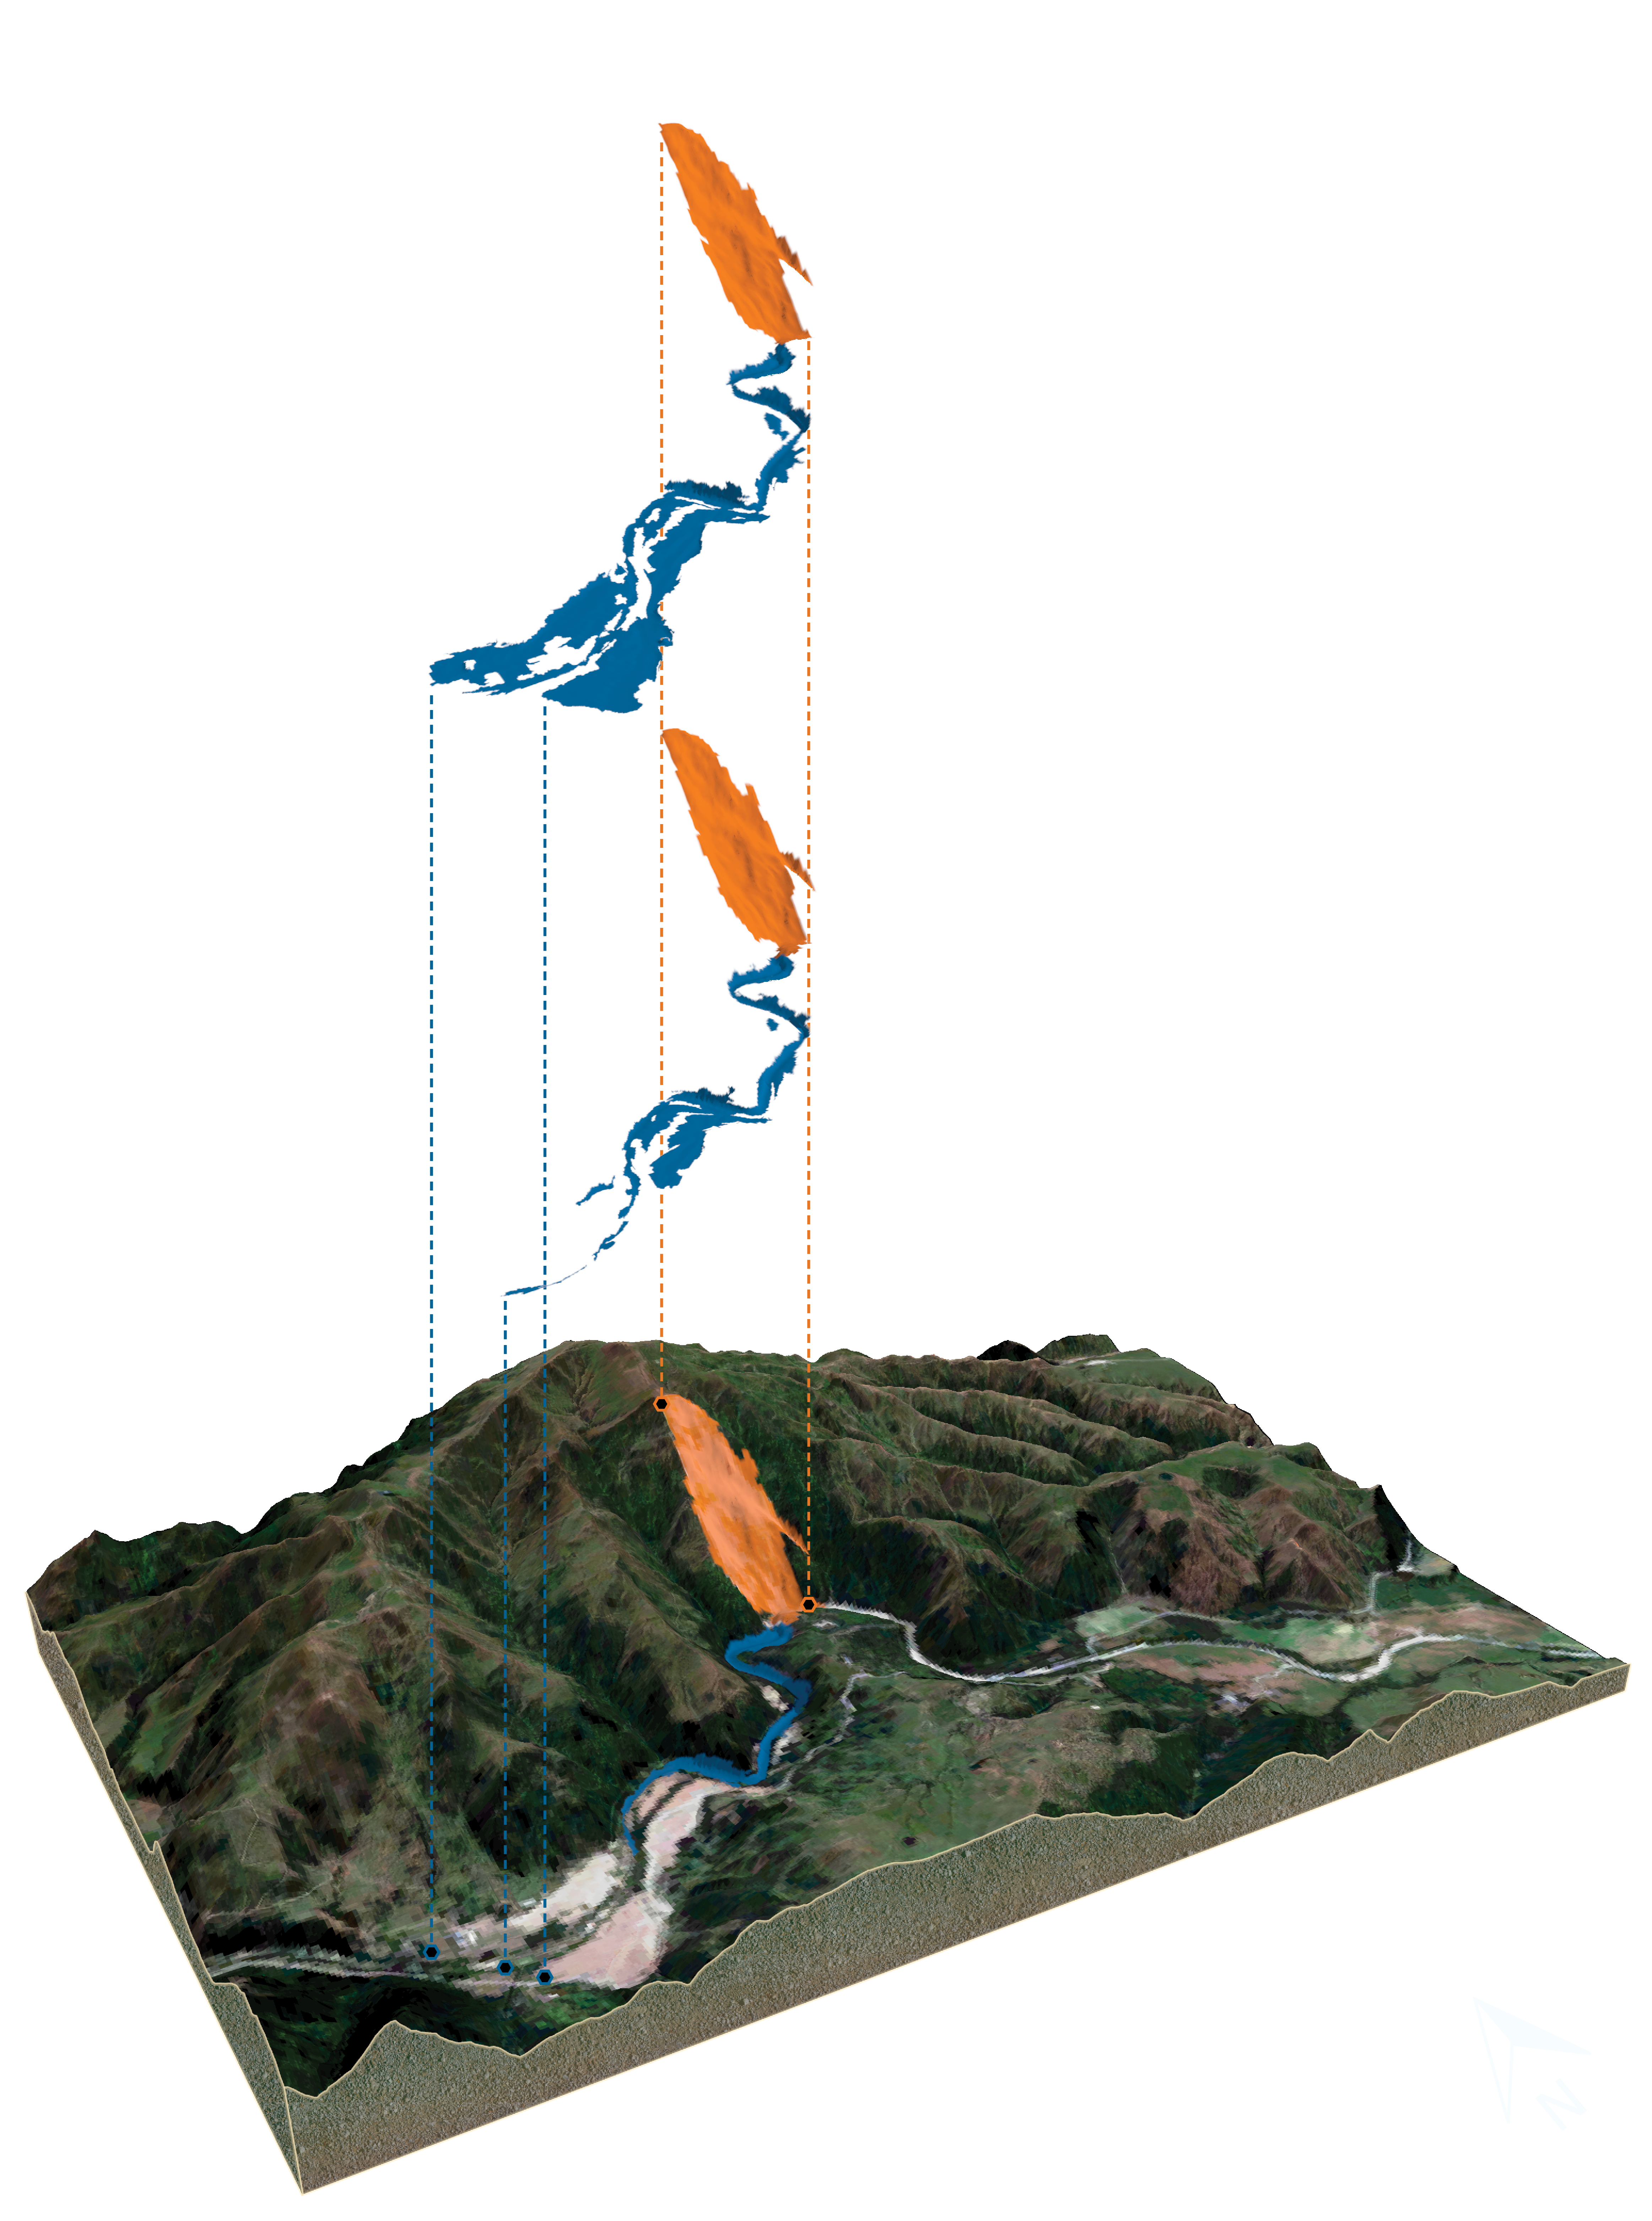
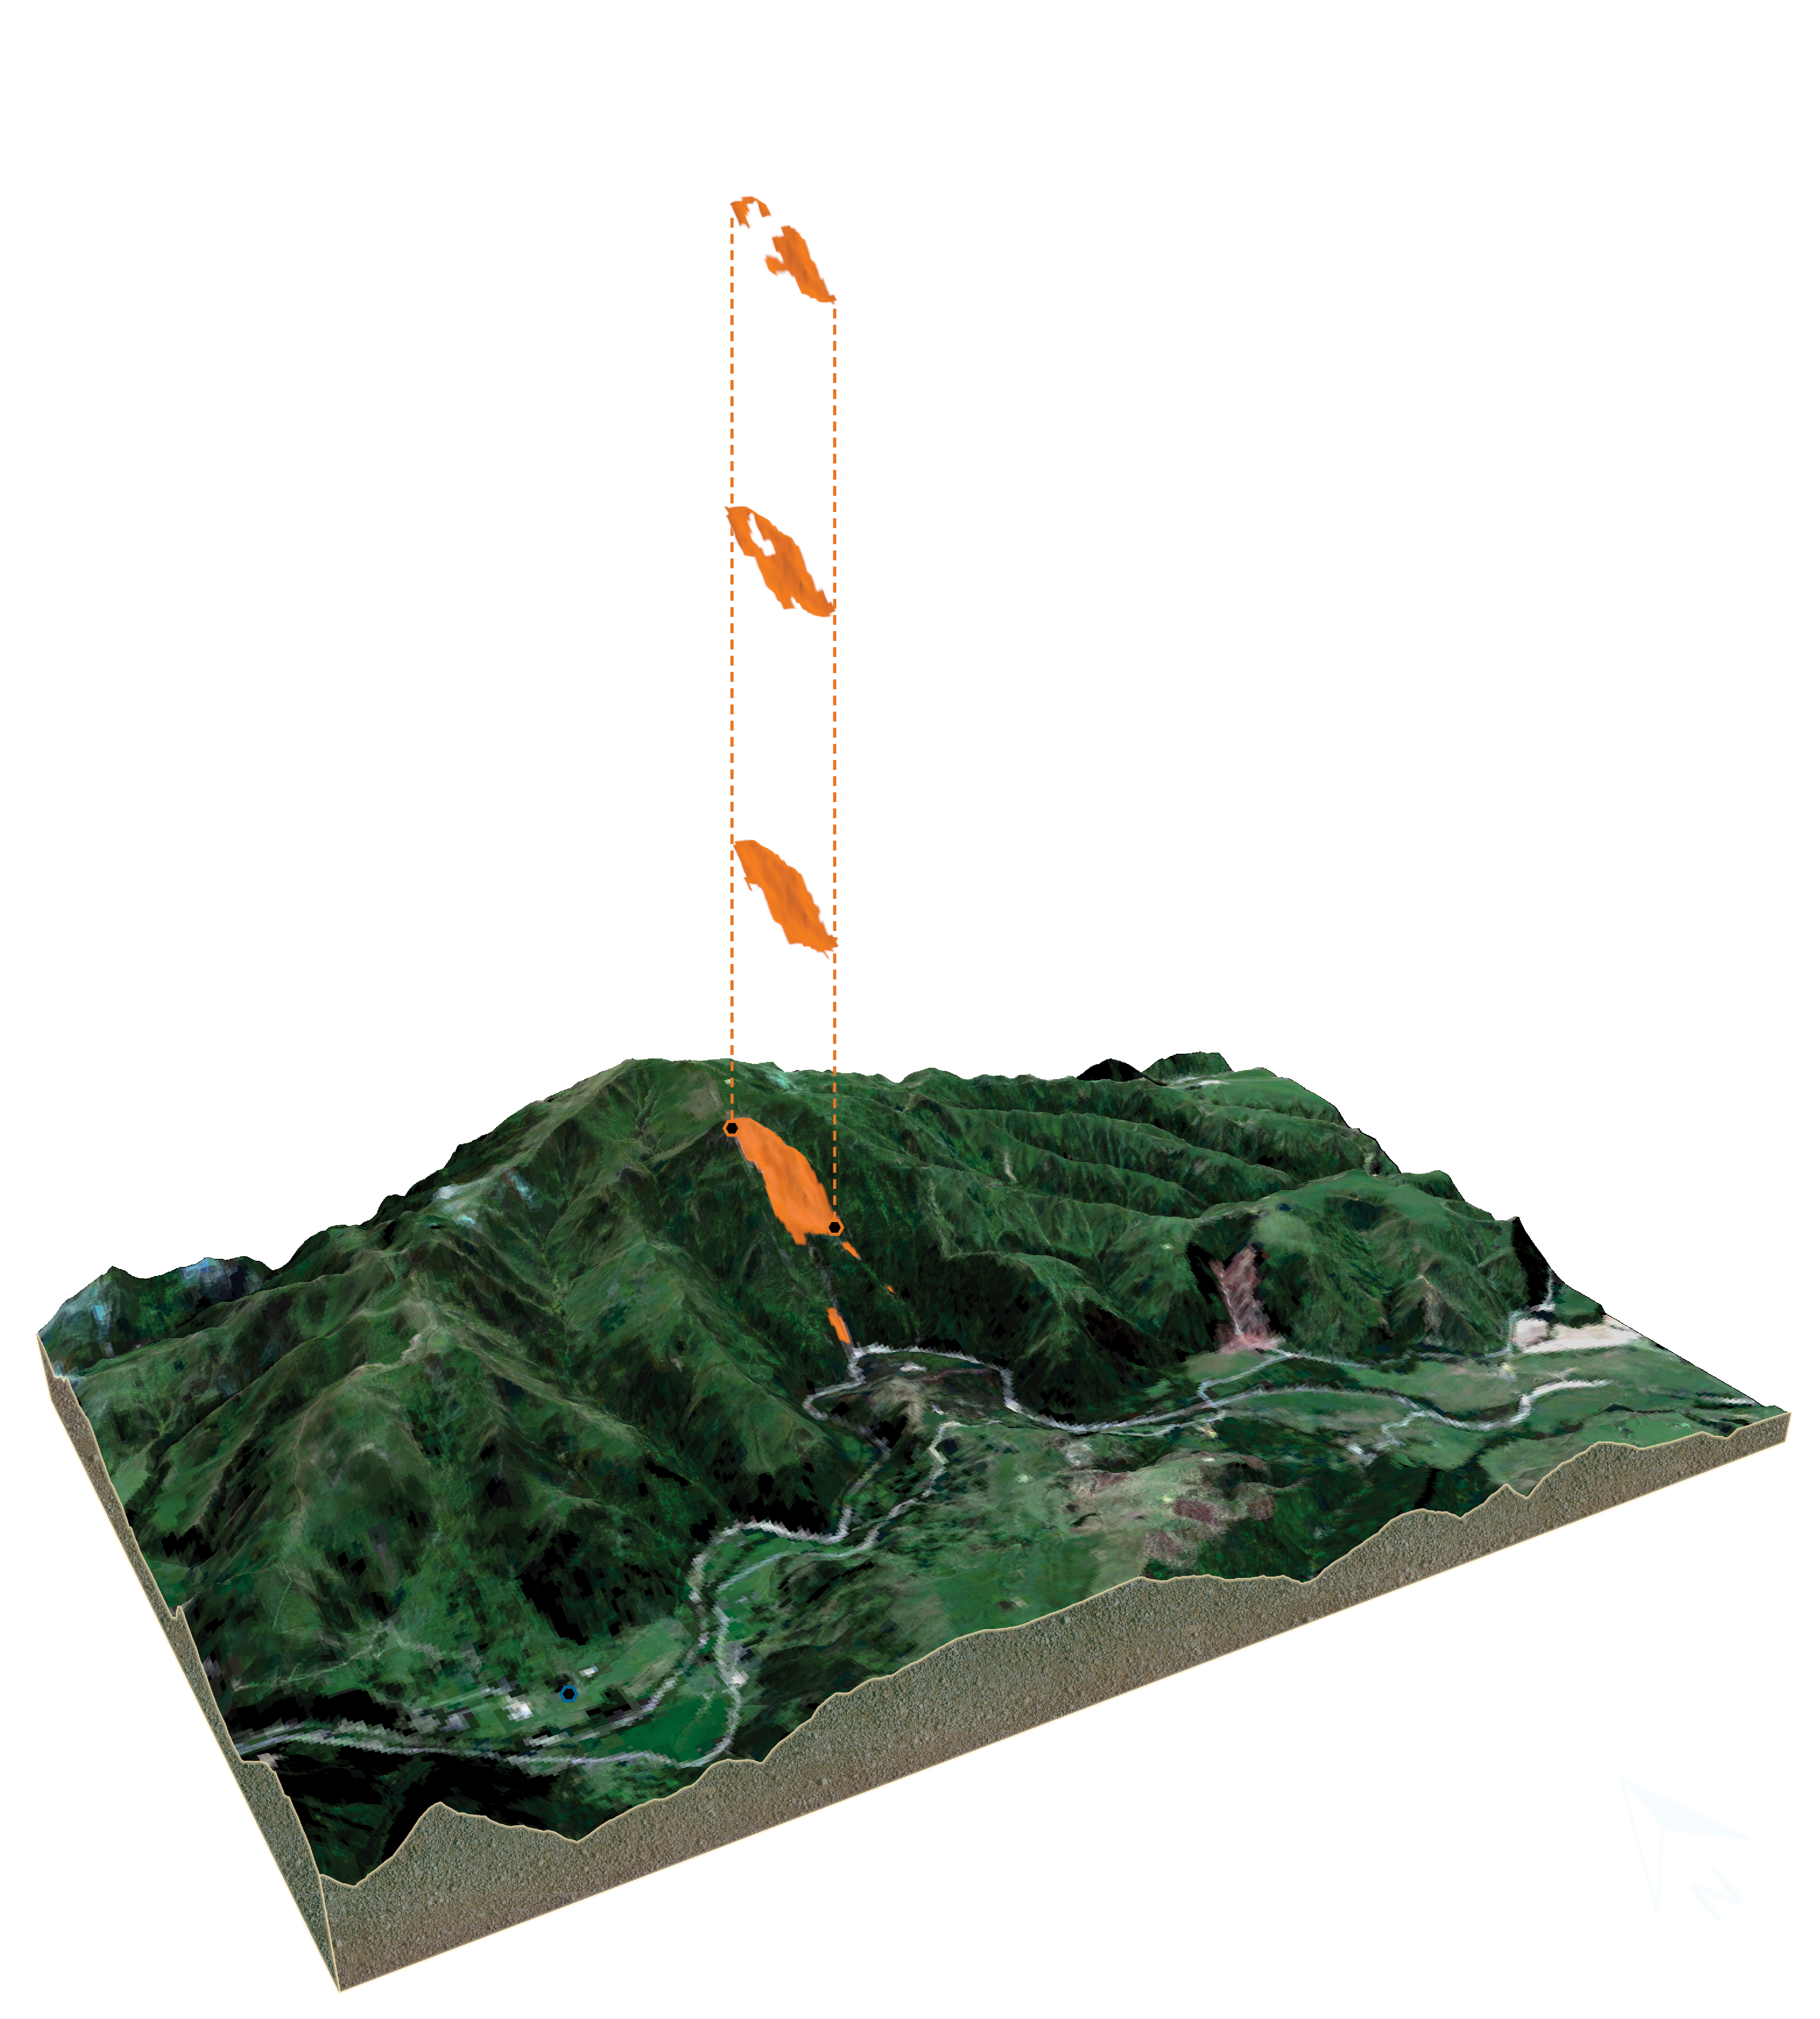
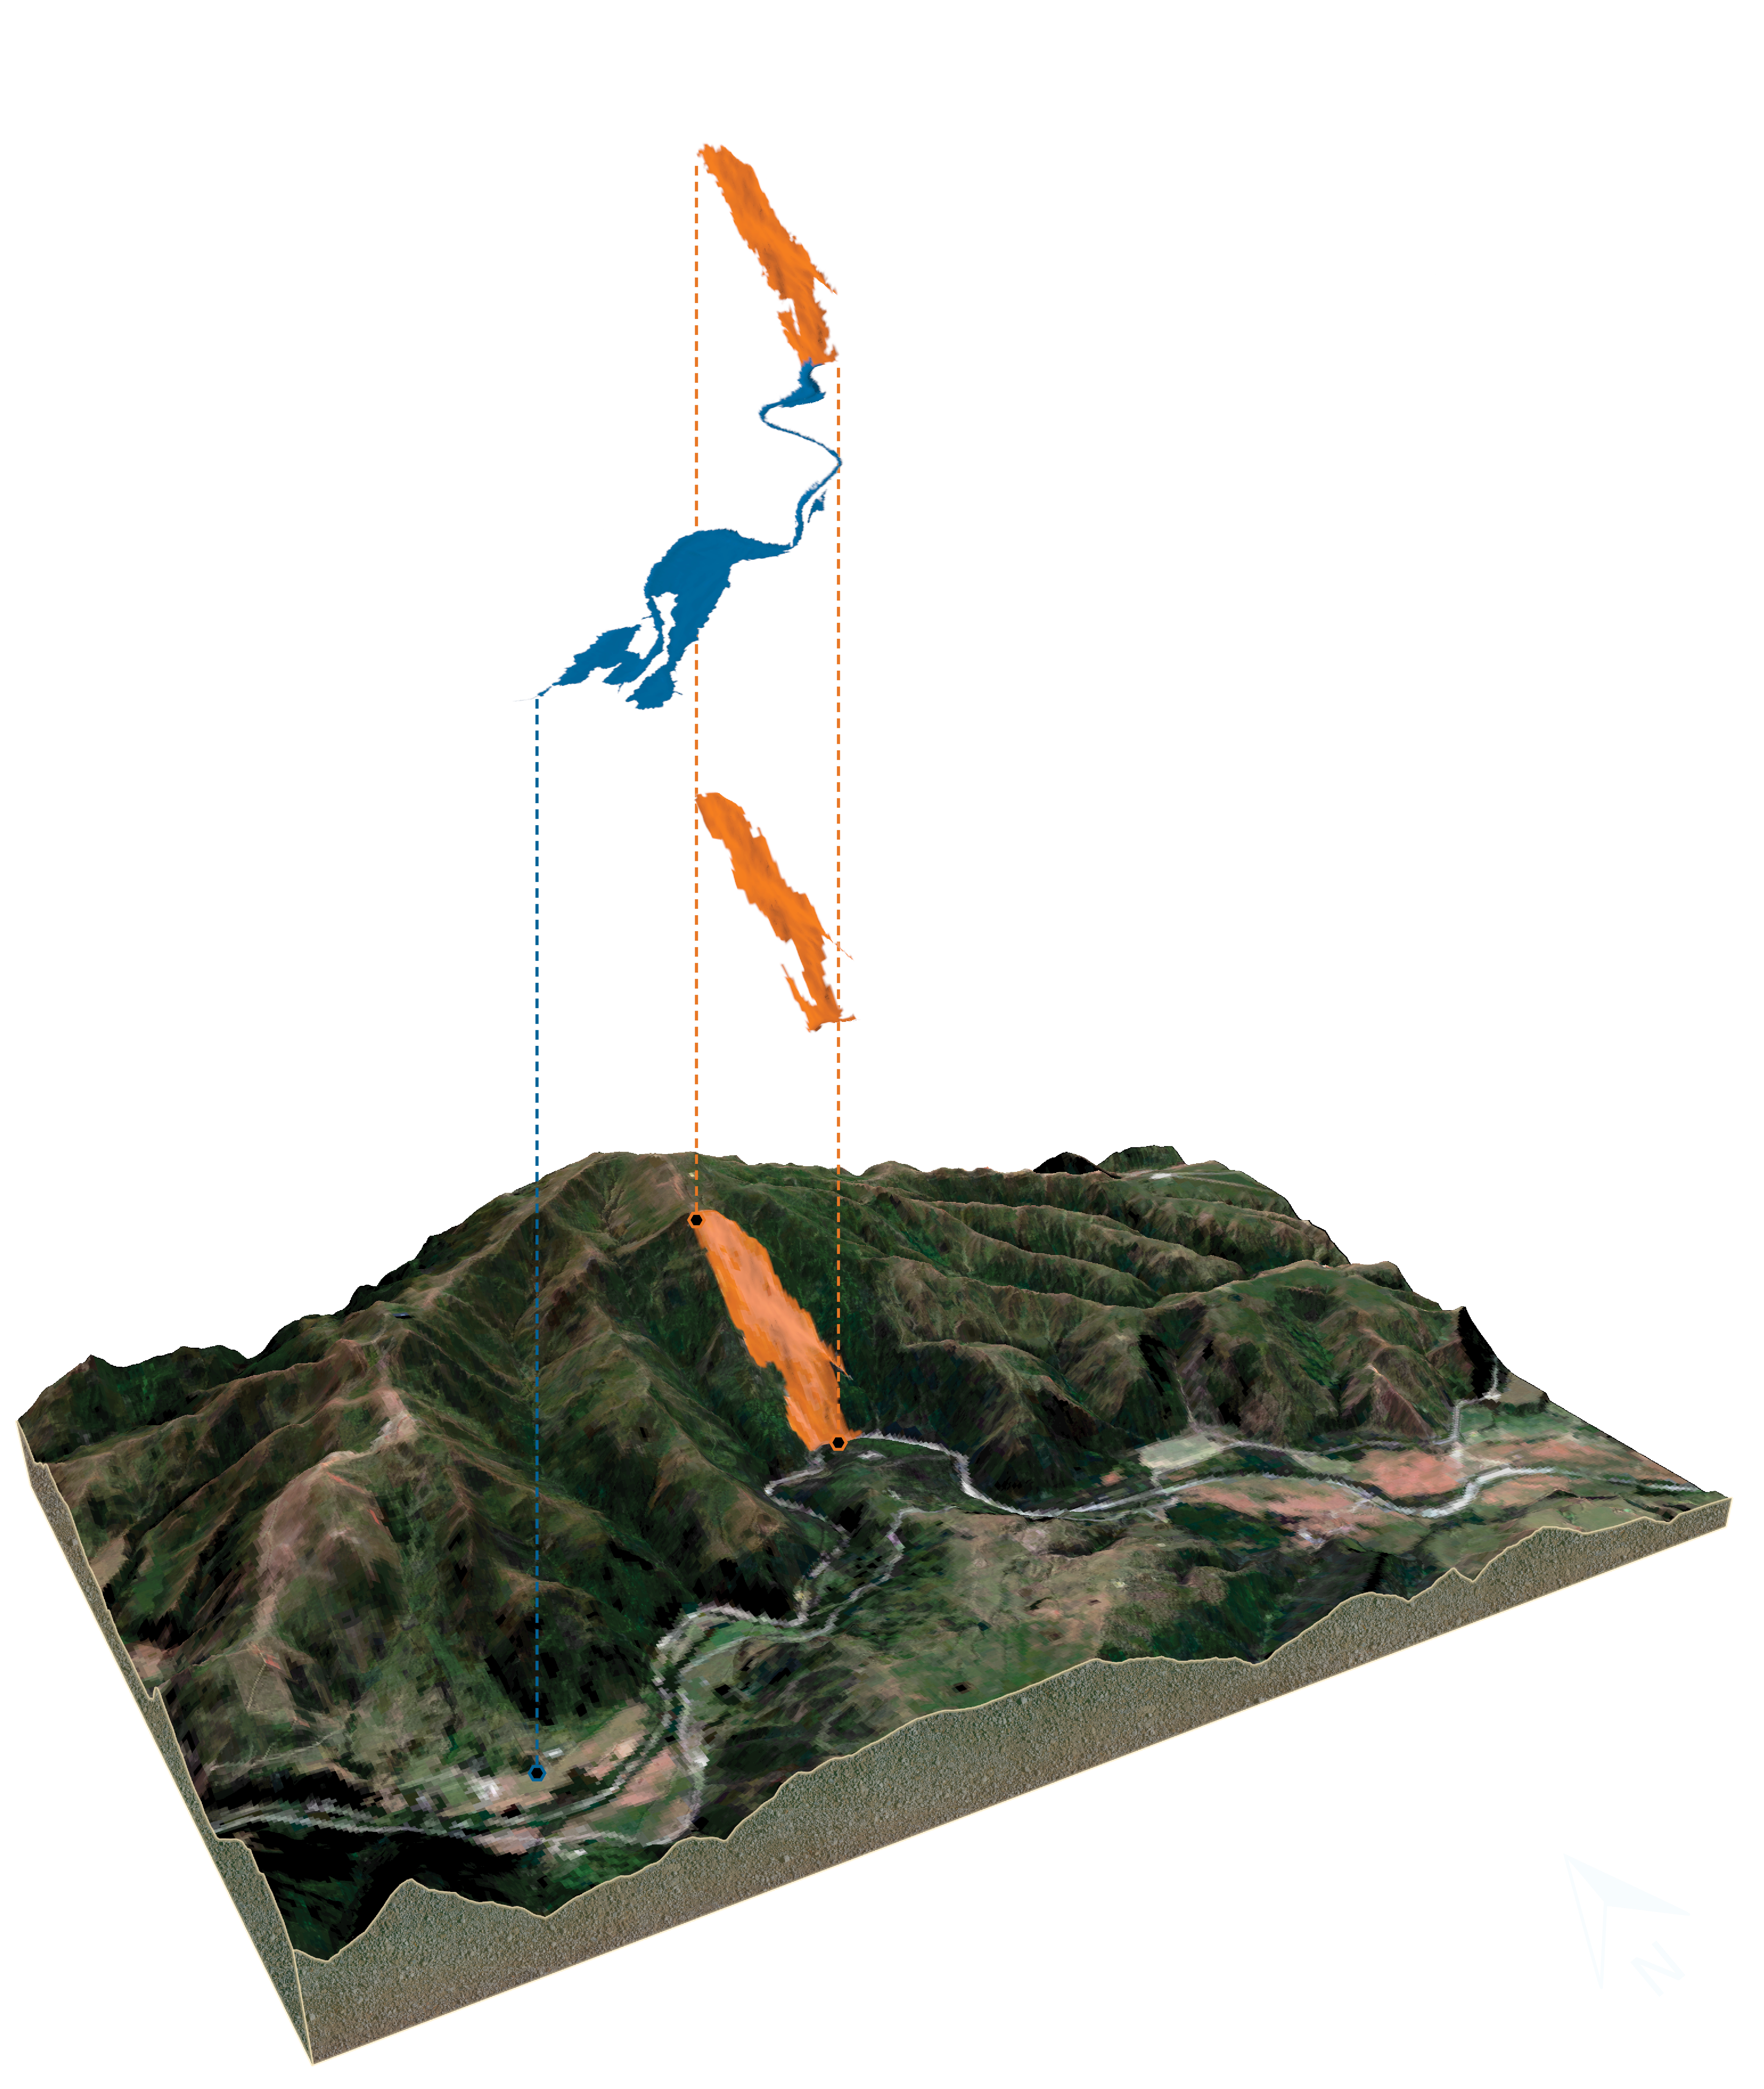
3D Web Visualization
QGIS2threejs provided the capability to generate 3D web model for visualizing the results of this study. By transforming 2D mapped results into 3D visualizations, it allowed exploring and interacting with the transformed landslide and landslide dammed classes in a 3D environment. The 3D web visualization was constructed using the DEM data and texturized using the satellite images. The OBIA results were modified to be clickable to provide an attribute table as a pop-up giving information about the mean values of the classification parameters. The generated application can be rotated, zoomed, and panned to view the data from different angles and perspectives. In order to improve the comprehension of the 3D Web visualization, set of narratives combined with motions were added to the model to inform the user about the area of interest, the story behind the cycle of incidents, and the applied OBIA methodology.
The findings of the study demonstrated the effectiveness of EO data, particularly Sentinel-2 imagery, in monitoring landslide evolution. Despite challenges such as cloud coverage and shadow effects during certain seasons, the spatial resolution of Sentinel-2 images was sufficient to capture and monitor the major landslide accurately. The study also highlighted the importance of integrating topographic data, such as DEM data, to enhance the accuracy and reliability of landslide mapping.
The semi-automated multi-scale OBIA methodology employed in this study proved valuable for consistent and reproducible landslide mapping. The iterative cycle of trial and error led to the development of a knowledge-based workflow that could be applied to various images and adapt to the evolving complexity of the landslide over time. Modifying an OBIA workflow consisting of multiresolution segmentation with different scales, classification and refinement parameters, using spectral indices such as NDVI, SAVI, pixel brightness, NDWI, and NIR image band combined with topographic features such as DEM, slope, and aspect led to a unique workflow that monitored the Kaiwhata landslide between 2017 and 2021.
Furthermore, the integration of 3D web visualization through the Qgis2threejs plugin provided an interactive and visually appealing platform to explore and comprehend the landslide results. The 3D visualization facilitated a better understanding of the topography and allowed for the identification of patterns that may not be readily visible in a 2D view. The interactive nature of the visualization, coupled with informative narratives, made it a potentially effective communication tool for decision-makers, stakeholders, and the public in landslide-prone areas.