Development of a georeferenced eye-movement data creation tool for interactive webmaps

Author: Minha Noor Sultan
Supervisor: Dr. Stanislav POPELKA
Co-supervisor: Prof. Dr. Josef STROBL
Year and place of work: 2020/2021 KGI Olomouc
CDE logoEplus logoUpol logoPlus logo

Abstract

This thesis study focuses on the development of a utility tool for eye-tracking data that is recorded on interactive web maps. The tool simplifies the labour-intensive task of frame-by-frame analysis on screen recordings with overlaid eye-tracking data in the current eye-tracking eco-systems. The tool’s main functionality is to convert the screen coordinates of participants to real world coordinates and allow exports in commonly used spatial data formats. This study explores the existing state-of-art in eye-tracking analysis of dynamic cartographic products as well as the research and technology aiming at improving the analysis techniques. The product of this thesis, called ET2Spatial, is tested in depth in terms of performance and accuracy. Several use-case scenarios of the tool are demonstrated in the evaluation section and the capabilities of GIS software for visualizing and analysing eye-tracking data are investigated. The tool and its associated pilot studies aim to enhance the research capabilities in the field of eye-tracking in Geovisualization.

Summary

What was the need?

Unlike static maps, the depicted content of the map in an interactive environment is dependent on various factors which change drastically as soon as an interaction is performed, such as pan or zoom. Although the present-day eye-tracking systems provide tools for evaluation of an animated medium, it is not efficient for the evaluation of a web map for a variety of reasons. First, the output reflects the screen coordinates through a recording of user’s interaction with the map. And doing a detailed analysis of the features on map at different scale levels would be very labour intensive as it would require frame by frame evaluation. In addition, these screen coordinates do not have the capability to provide intuition from a spatial perspective. Secondly, evaluating data of multiple participants on the same map simultaneously requires exhaustive inefficient efforts.

What were the objectives?

The aim of the thesis was to develop a tool that would allow recording the eye-movement data observed during interaction with a web map as spatial data. The tool would take into account user interaction variables such as zoom and scroll. The tool would allow easier analysis of eye-tracking data in the realm of interactive online maps. A part of the study was to explore existing solutions for eye-tracking analysis on dynamic web maps. The ambition was to build a tool that would potentially serve as a general utility in different research eco-systems, but at the same time serve the niche needs of the Geoinformatics department at the university. The eventual objective was also to demonstrate the proof of concept through several use-case studies.

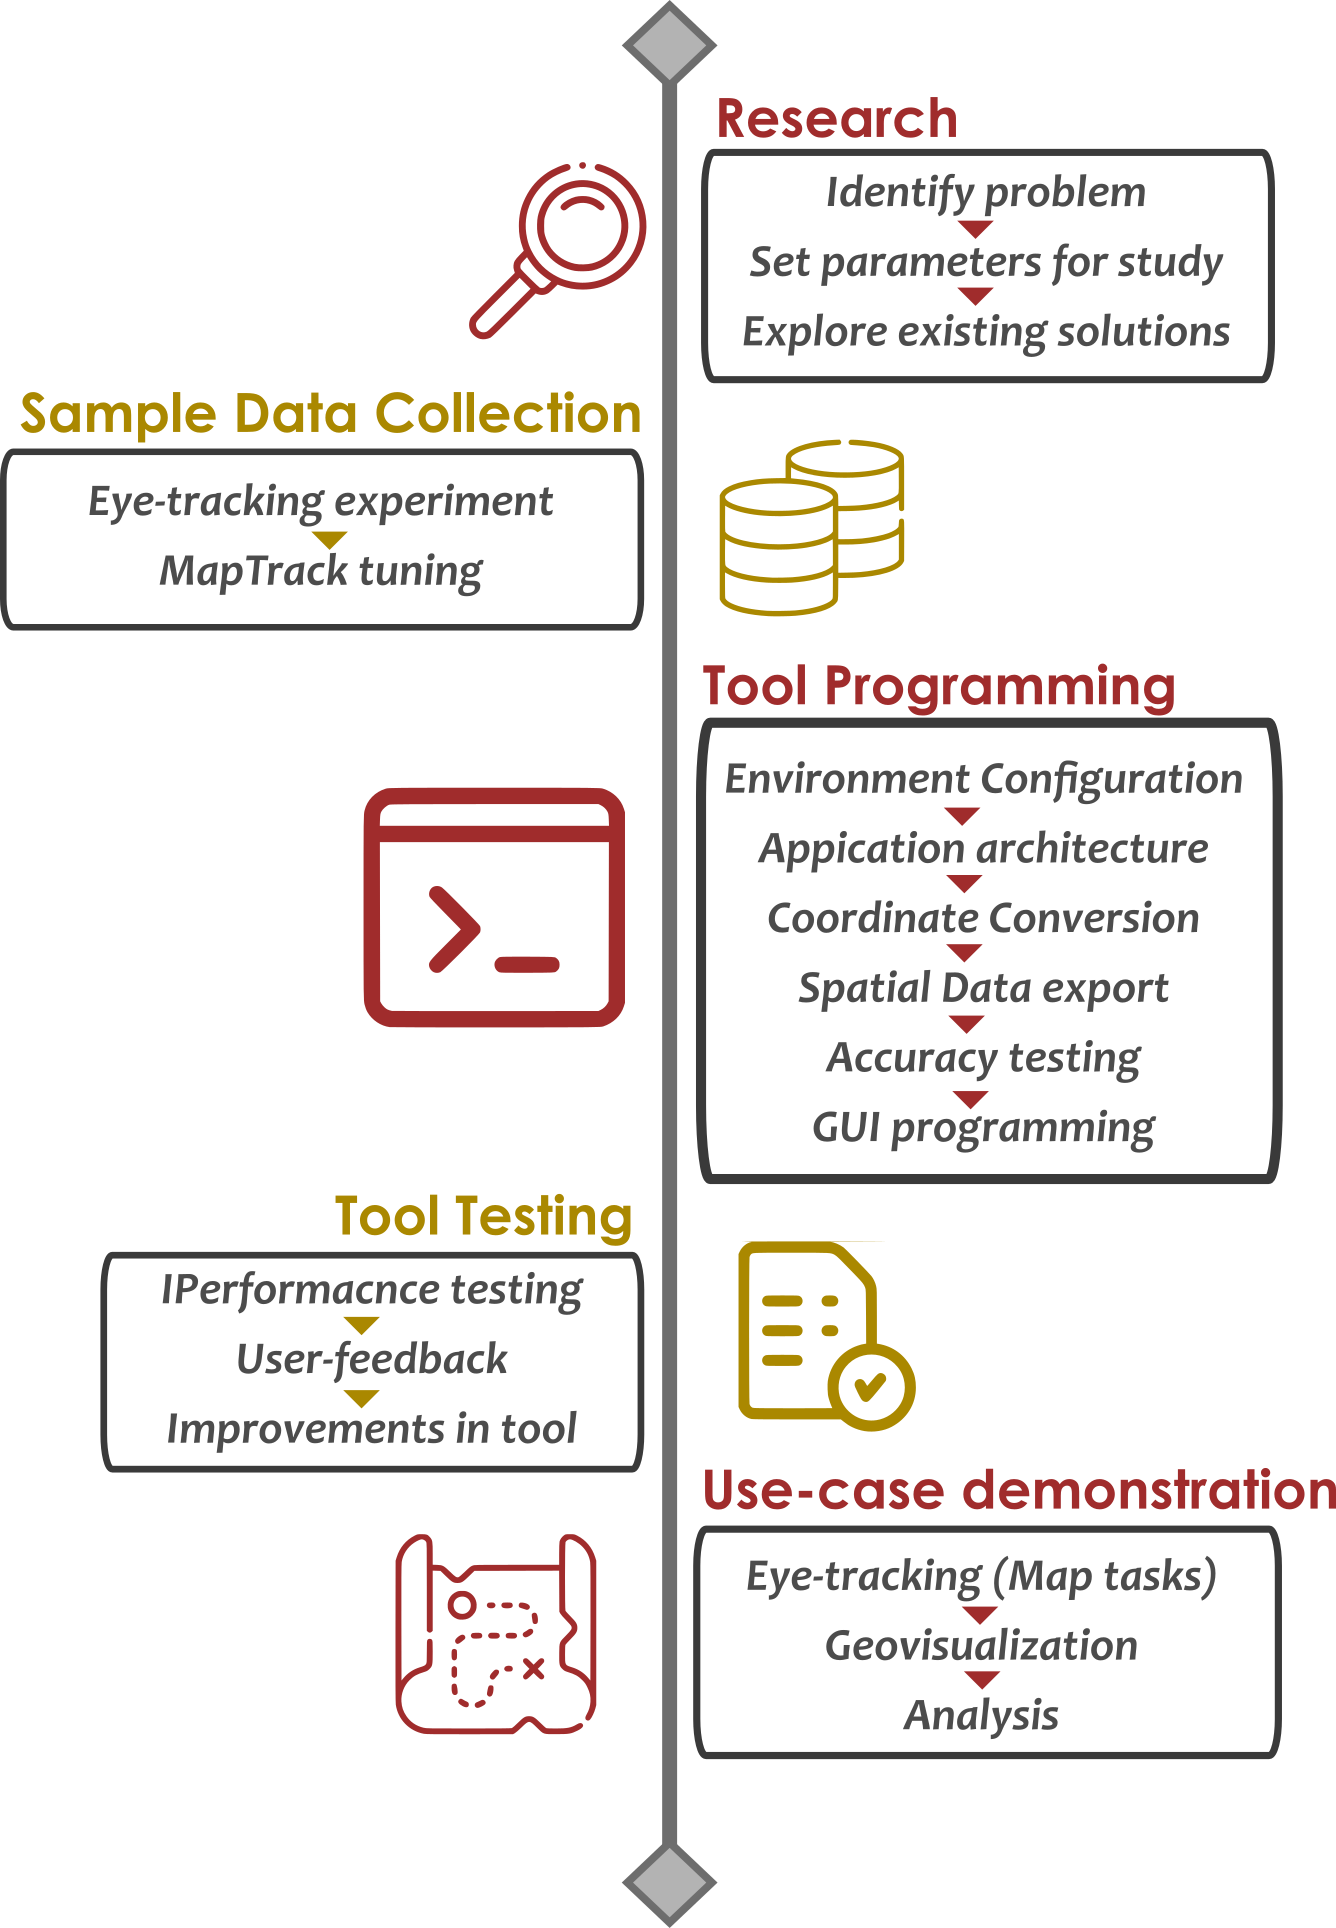
What was the workflow?

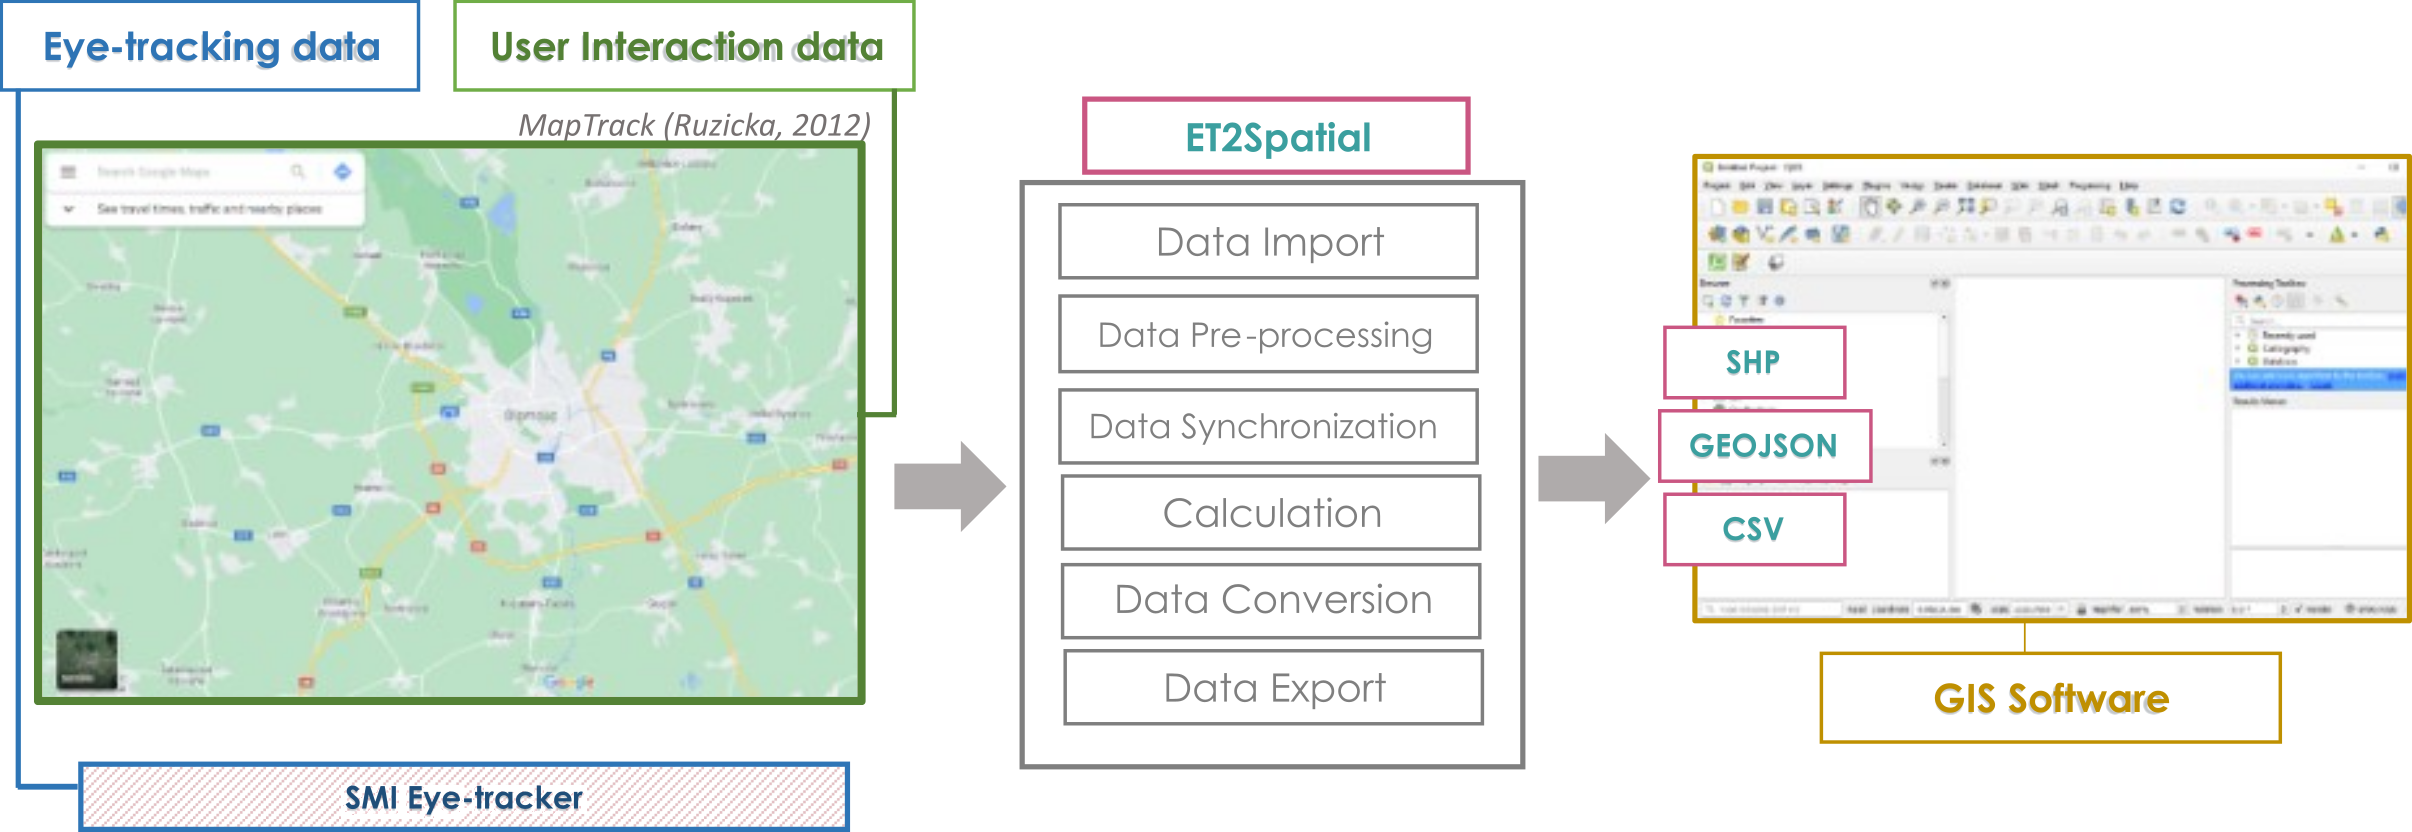
The programming of the tool required initial data to work with which consisted of eye-tracking data and the user interaction data. This sample data was collected for one participant only. The eye-tracking data was recorded through SMI RED 250 eye-tracker and was exported through the SMI BeGaze software. This data mainly consisted of two exports pertaining to the eye-tracking metrics, the raw data points and the fixation data points. The other data was the user-interaction data which was exported through MapTrack (Ruzicka, 2012), an online application that logs basic map actions such as map center coordinates, zoom level and time.

A scripting environment was then setup by installing opensource technologies; python, pyqt5, pandas etc. Based on the designed architecture of the system, the first task was to pre-process all datasets after imports. These datasets were then synchronized based on time and later stitched together. For the conversion of screen coordinates to geographical coordinates several logics and formulas were separately tested in a script. On each of these approaches, accuracy testing was performed to check which one had the highest and which was later adopted for the tool itself. The next task focused on determining suitable methods for 
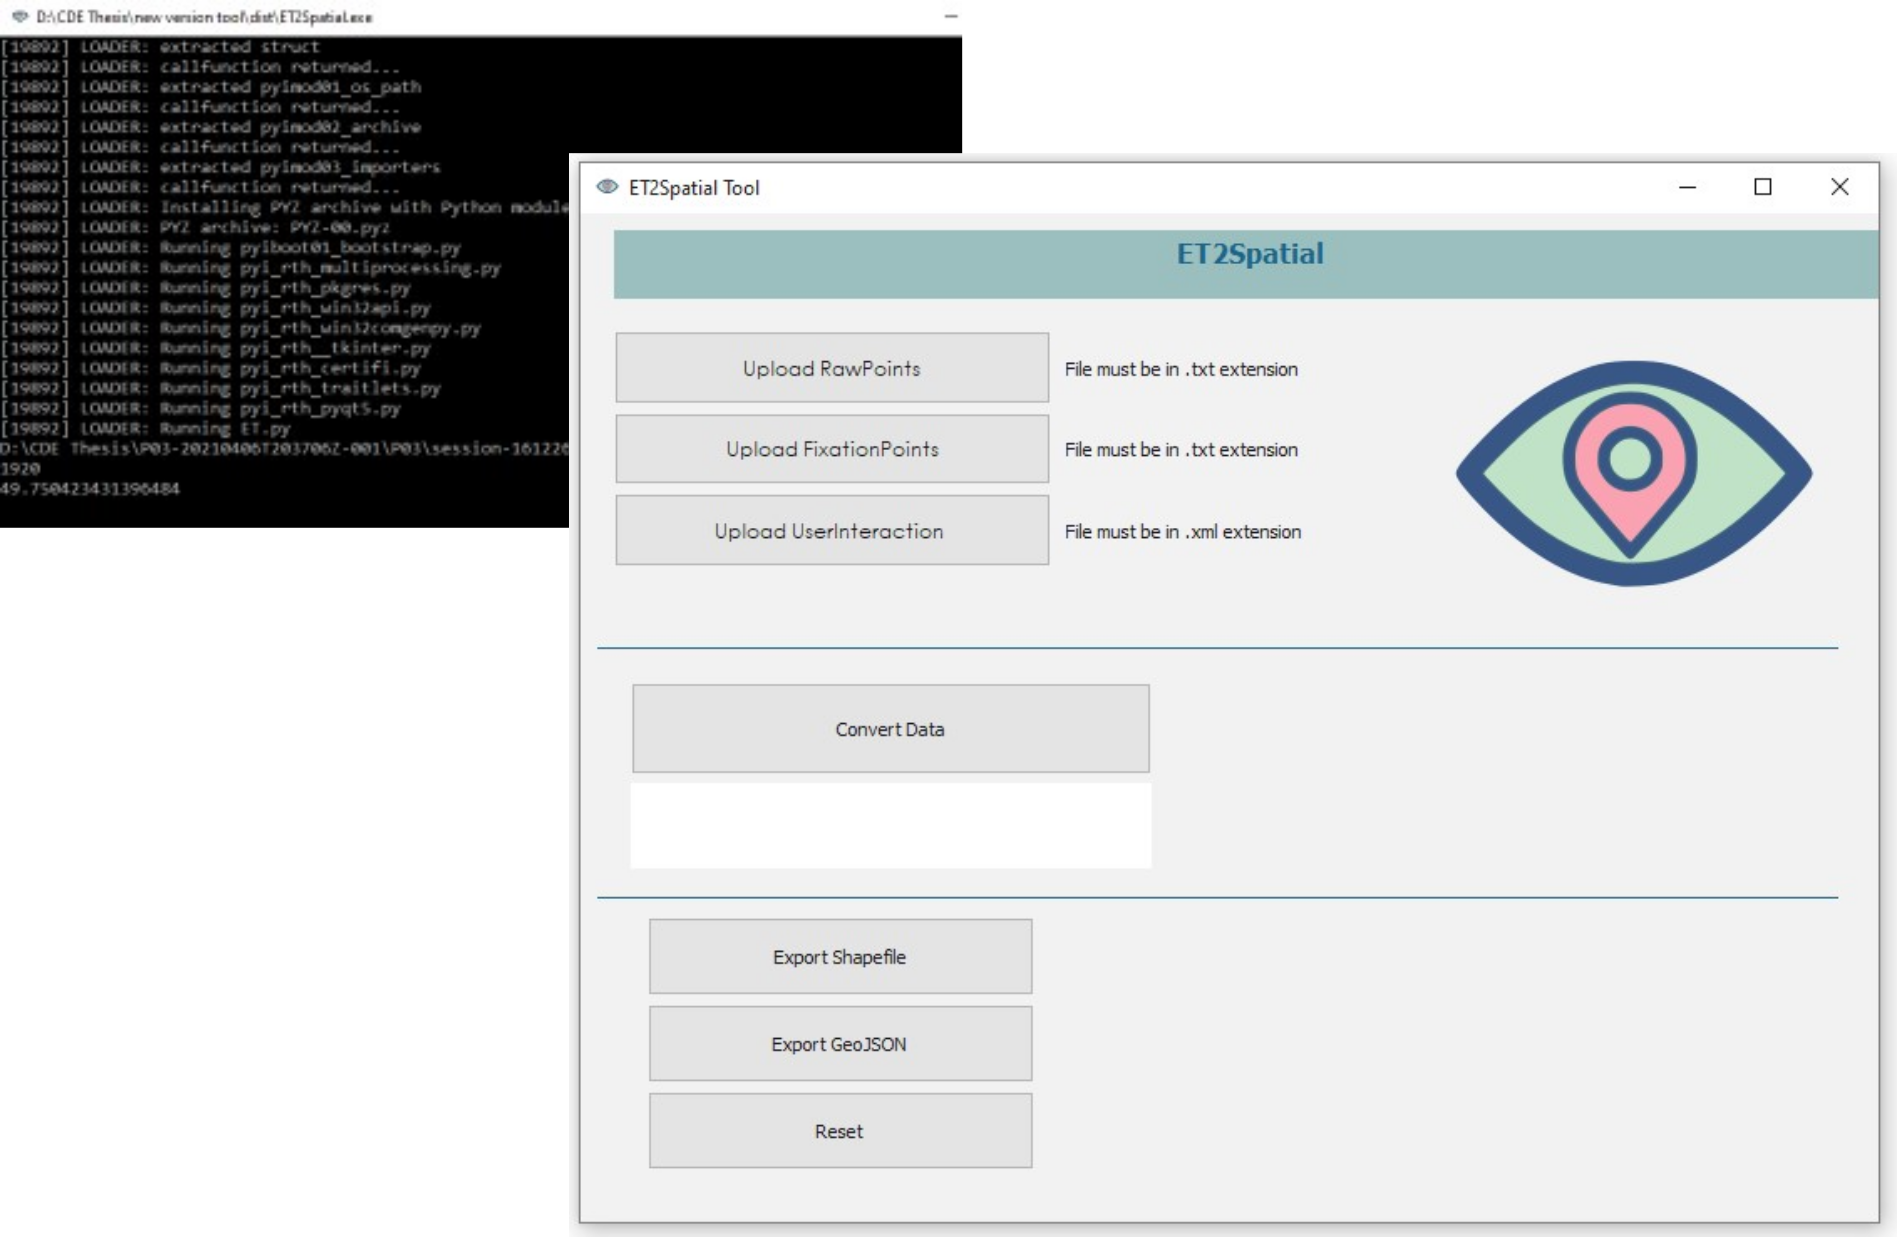
conversion of the new data files to the desired output file formats.

Once the script was functional and giving expected output a GUI was designed. The tool was given a name ‘ET2Spatial’ accompanied by the design of a logo. The GUI was programmed and stitched to the main code and compiled afterwards as a stand-alone exe file.

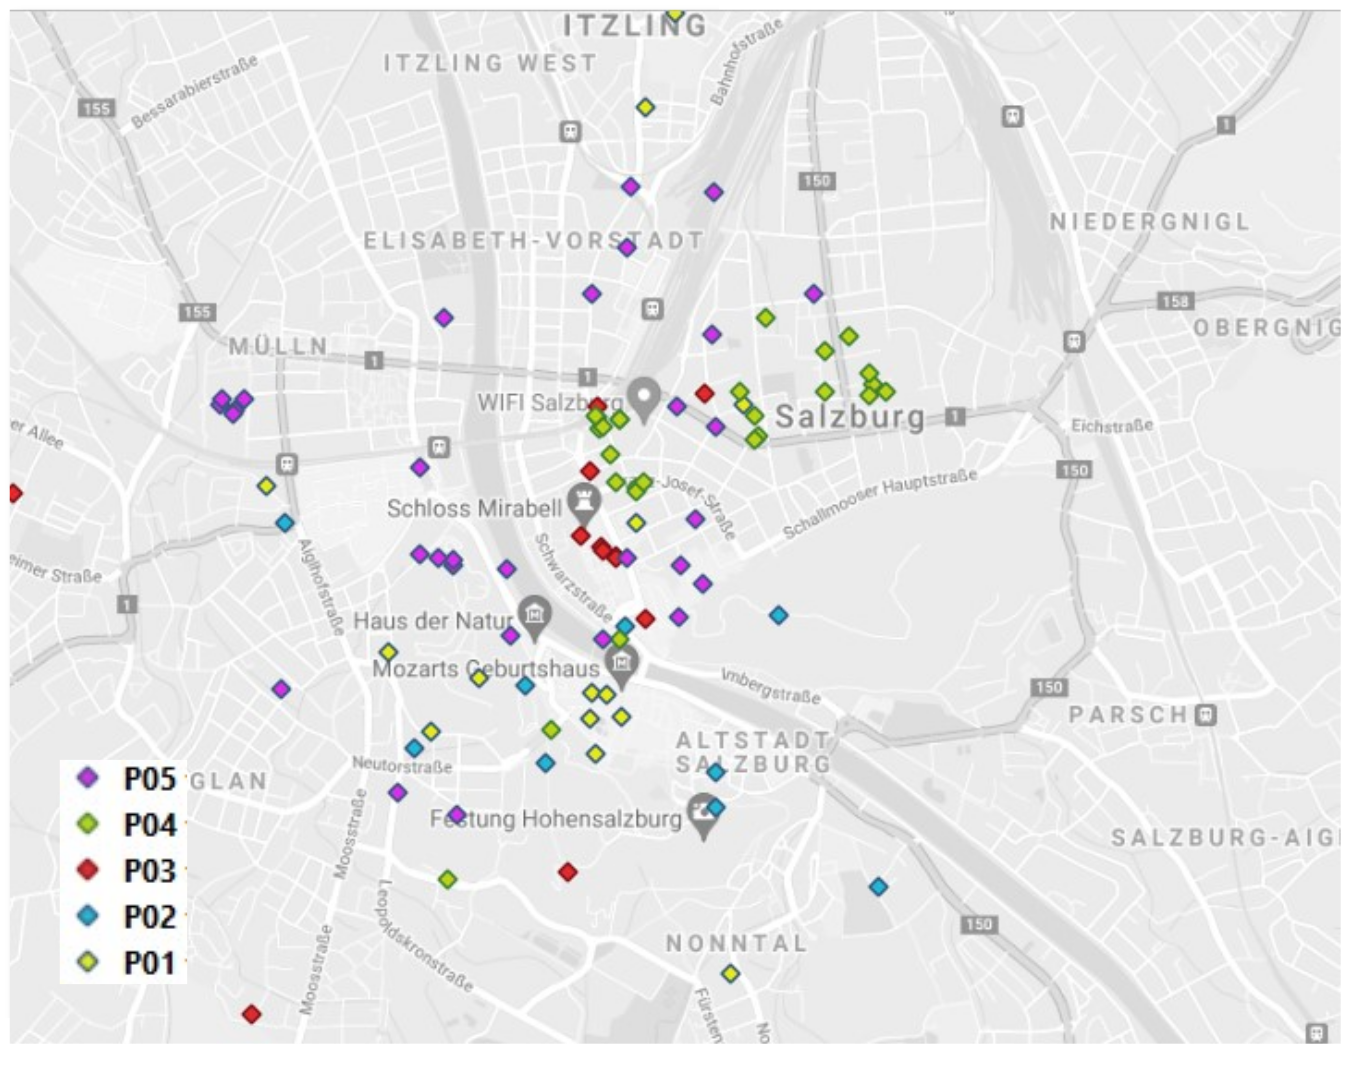
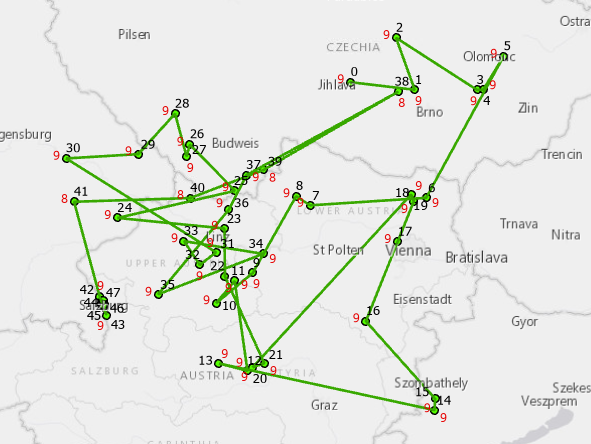
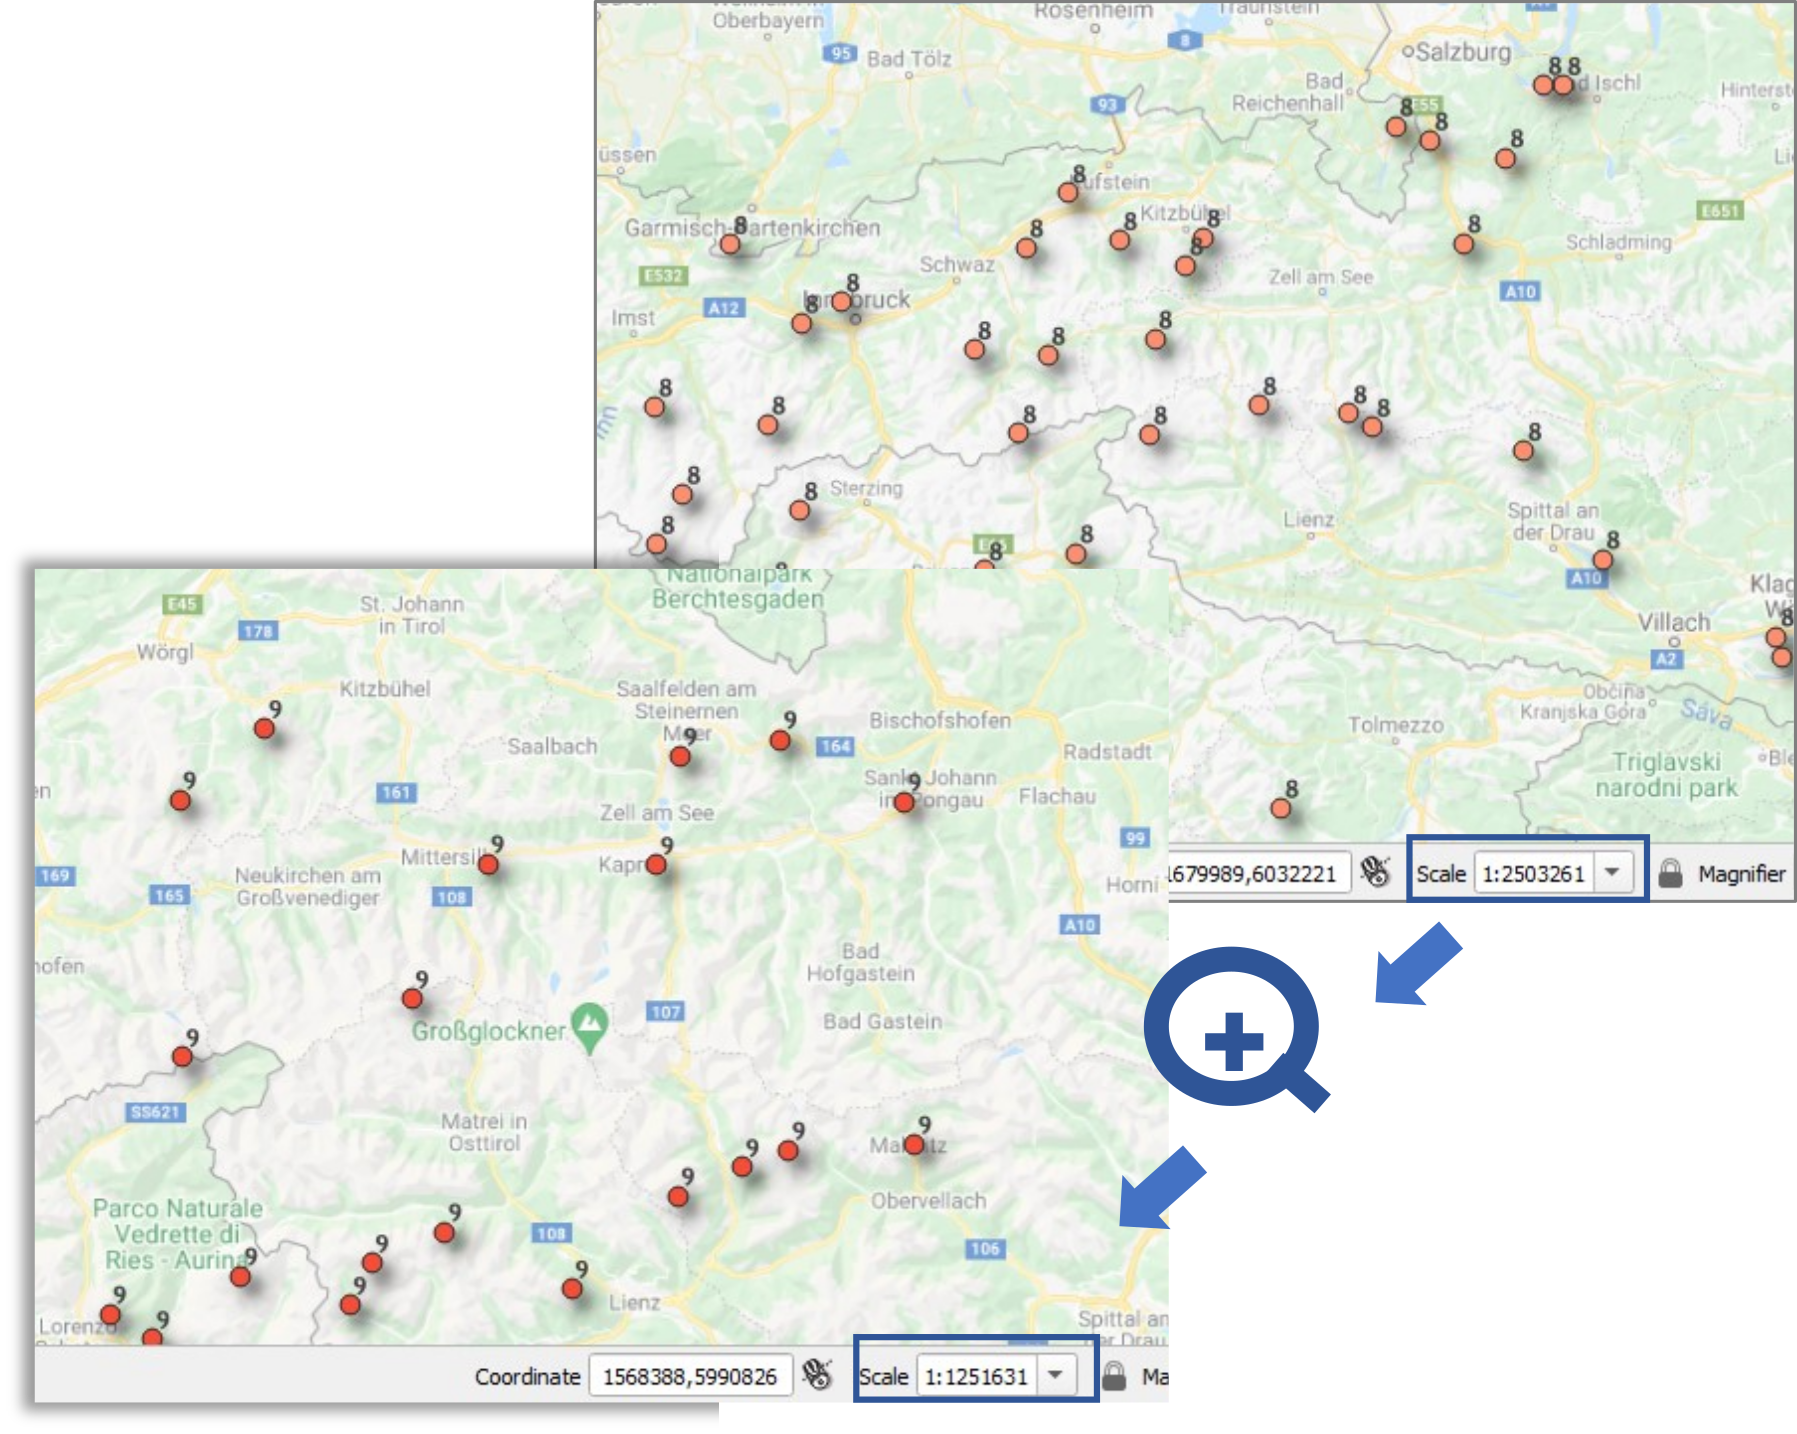
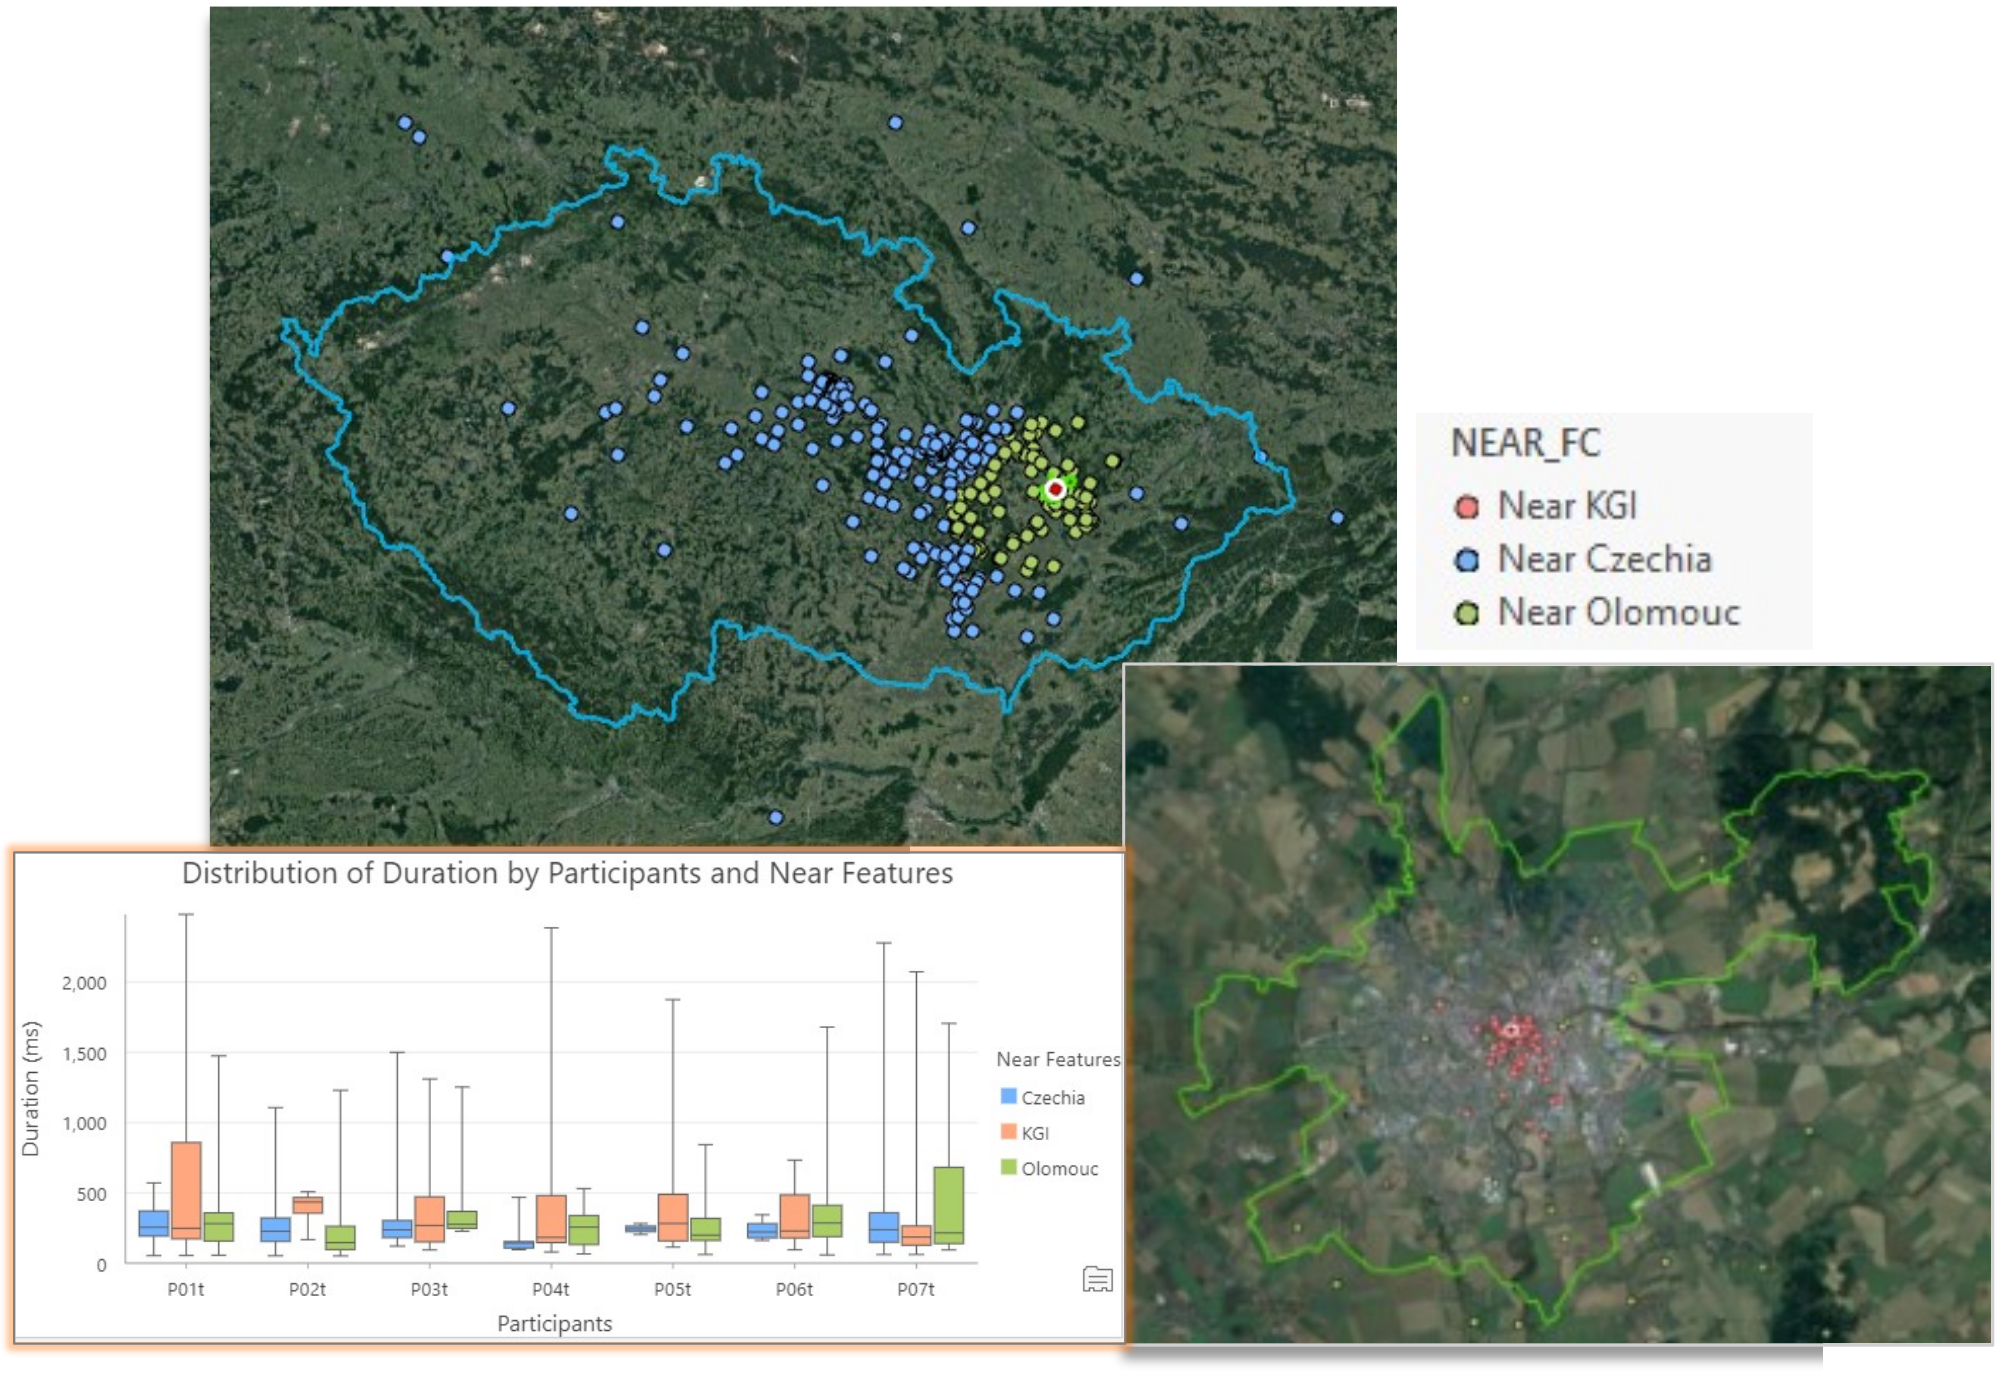
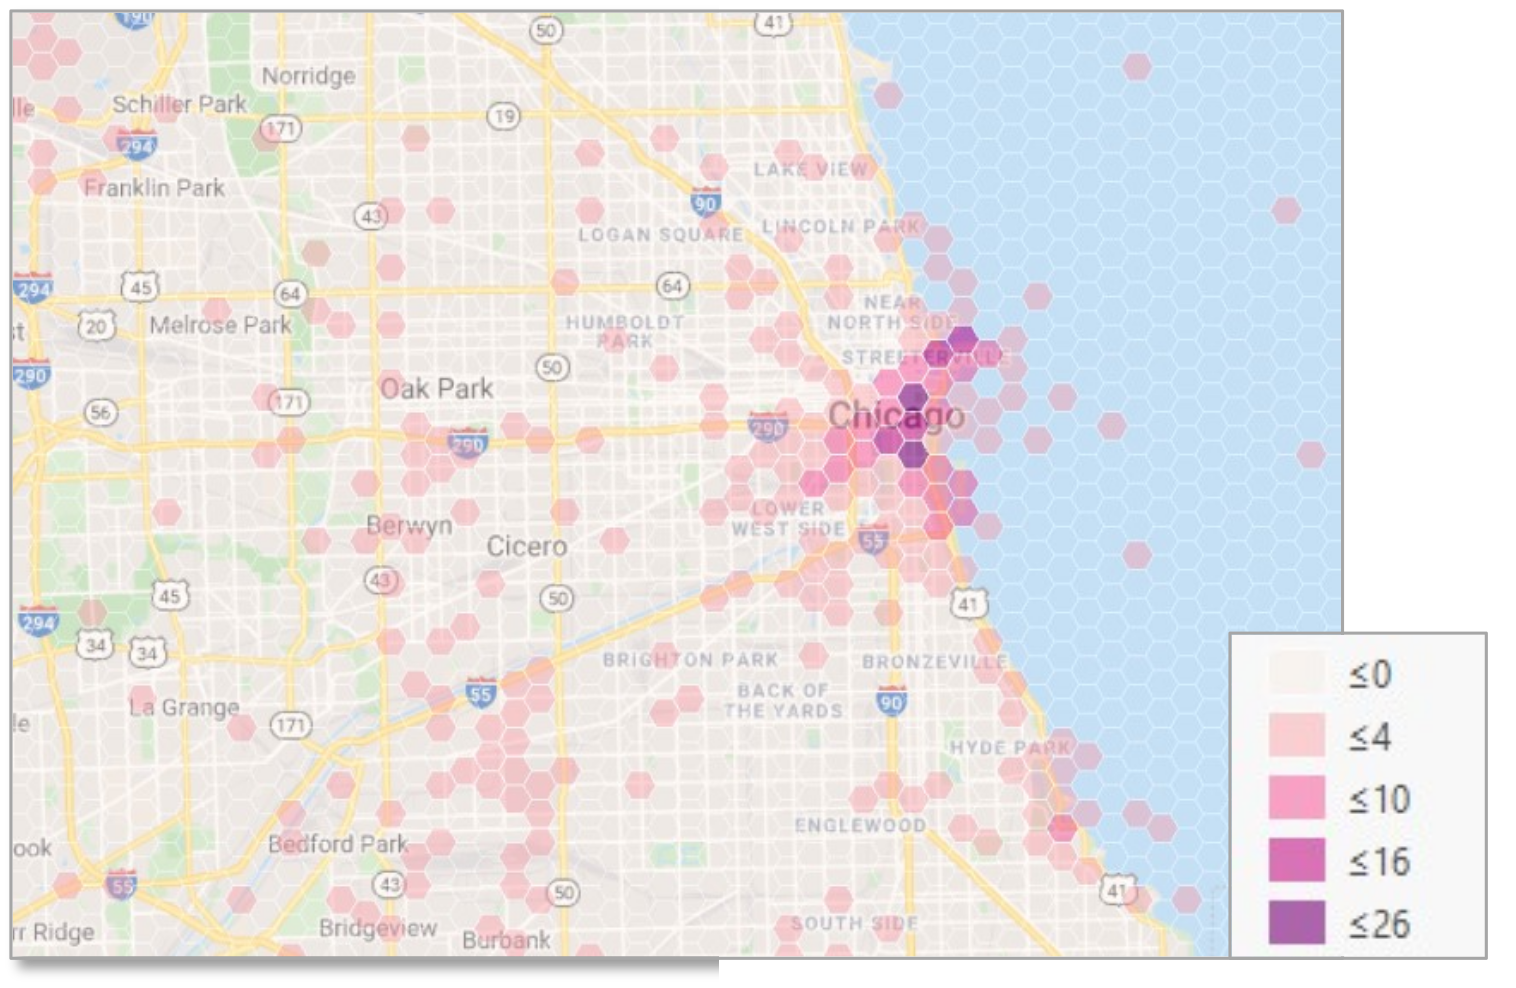
The final objective, which was to demonstrate use cases, was done by collecting more participants’ data in the eye-tracking lab and processing this data in GIS software.

Timeline Figure

What is the concept?

From a user perspective, a typical workflow activity would involve conducting ET experiments on a web map such as Google Maps displayed through MapTrack application on the screen of an ET setup. The data from both, ET device and the MapTrack application would be fed to the ET2Spatial tool. The tool then converts the points in the datasets to spatial features that can be imported into any GIS software and overlaid for multiple participants on a cartographic basemap.

Concept Figure

Output

The main result of this thesis was a tool, ET2Spatial. ET2Spatial is a desktop-based tool that allows conversion of eye-tracking points, recorded on an interactive web map, to real world coordinates. The tool is built on python and in the form of a stand-alone executable file. It is capable of running without any additional installations.The main inputs of the tool are Raw eye-tracking points, Fixation eye-tracking points and User interaction data. The tool gives outputs in three formats, ESRI Shapefile, GeoJSON and CSV. Every output file contains the geographic coordinates of points and attribute values such as zoom level, sequence of points, and fixation duration. The conversion of points from screen coordinates to geographic coordinates is done primarily through forward and reverse Web Mercator projection formulas. The tool has been examined for performance on multiple participants and in total 34 datasets were put to test for conversion.

Output Figure

Proof of Concept

The main goal of the tool was to ease the eye-tracking analysis of web maps, which was evaluated and demonstrated through multiple use-case scenarios in ArcGIS and QGIS. Four eye-tracking experiments were carried out with seven participants, each of whom were asked to solve certain map tasks. The data for these experiments were converted through ET2Spatial tool and imported in GIS software which allowed for not only good visualization techniques but also helped evaluate the points from a spatial perspective. Some of the use-case scenarios are shown below. (For more use-case demonstrations view the full text).

Visualization Figure
Figure 1: Multiple participants eye-tracking points superimposed on basemap in ArcGIS Pro.
Visualization Figure
Figure 2: Custom scanpaths recreated in GIS environment, with additional capability of labeling by zoom level.
Visualization Figure.
Figure 3: Scale-based rendering of points on Google basemap in QGIS. Points recorded at zoom level 6 during eye-tracking experiment of a participant are displayed only on scale associated with zoom level 6 during analysis in GIS environment. This allows interactive analysis of eye-tracking on web maps.
Usecase Fig
Figure 4: An example of combining eye-tracking data with spatial data for analysis. User's eye fixation points are superimposed on a Google satellite basemap without labels. The map task asked users to find KGI (Department of Geoinformatics UPOL) building on the map. The boundary shapefiles of Czech Republic, city of Olomouc and the location of KGI were used to analyze which points were nearest to which boundaries and how close to target location.
Usecase Fig
Figure 5: An example of fixation density overlay on Google basemap with the city of Chicago as aoi. The density zones represent which districts or areas were most focused on by the users during a free viewing task.